Chart
Properties of the Chart component in Ilevia Manager, how it is displayed in Ilevia Control, and a step-by-step guided configuration example.
Introduction
This component lets you create charts from the collected data and display them in the user interface. Any information coming from a sensor, meter, or switch can be represented in a chart.
Use cases
You can use the Chart component to monitor electricity consumption and production.
Before you start
This component requires some preliminary configuration. The components required for the correct operation of the Chart component are listed below.
Component Logger
Component Info
Download and install Ilevia Logic to enable the plugins (link);
After uploading the .eve project to the server, wait a couple of minutes for the logic to activate.
Component properties
The component title and icons can be changed. See the “Common properties” guide for more information.
Graphical user interface (GUI)
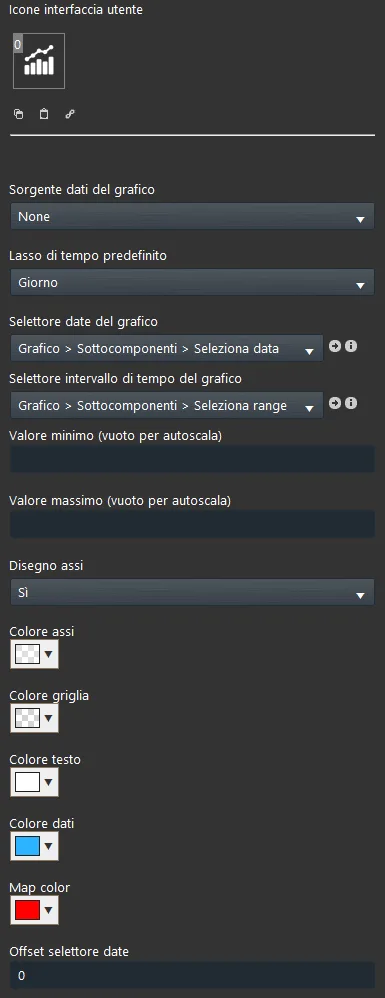
Chart data source: the component that defines which data is shown in the chart; from any Logger you can choose which data to log.
Default time range: time display mode (Day, Week, Month, Year);
Chart date selector: the Select date component that lets you choose the date within the chart;
Chart time range selector: Option list component that lets you select specific sections within the chart;
Minimum value: minimum axis value; if left blank, the value scale is set automatically;
Maximum value: maximum axis value; if left blank, the value scale is set automatically;
Draw axes: allows you to enable or disable axis drawing; in map view it allows one or more charts to overlap;
Axis color: select a color for the axes;
Grid color: select a color for the grid;
Text color: select the text color;
Date: select the color of the date shown in the chart;
Date selector offset: allows you to set the same time offset in different charts.
There are three possible display modes: “CLASSIC”, “MODAL”, and “HIDDEN”. For more information, see the “Common properties” guide.
Component display in the user interface
Display of time modes in the user interface
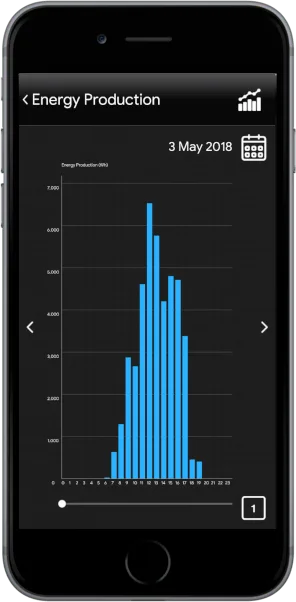
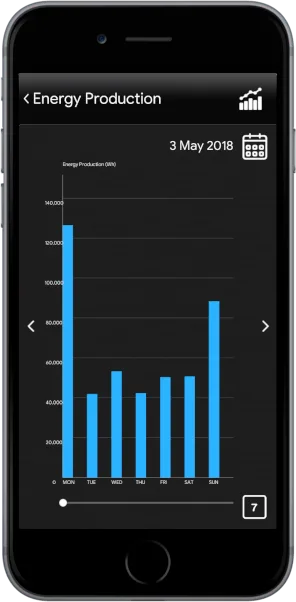
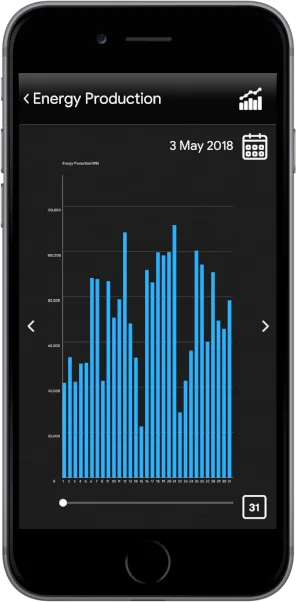
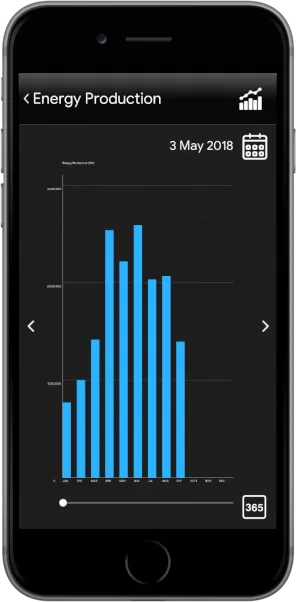
Chart display in Ilevia Remote Plus (Classic and Map view)

The chart date is shown next to the date selector icon.

Date selector icon. It lets you select a day in a specific year to view its data.
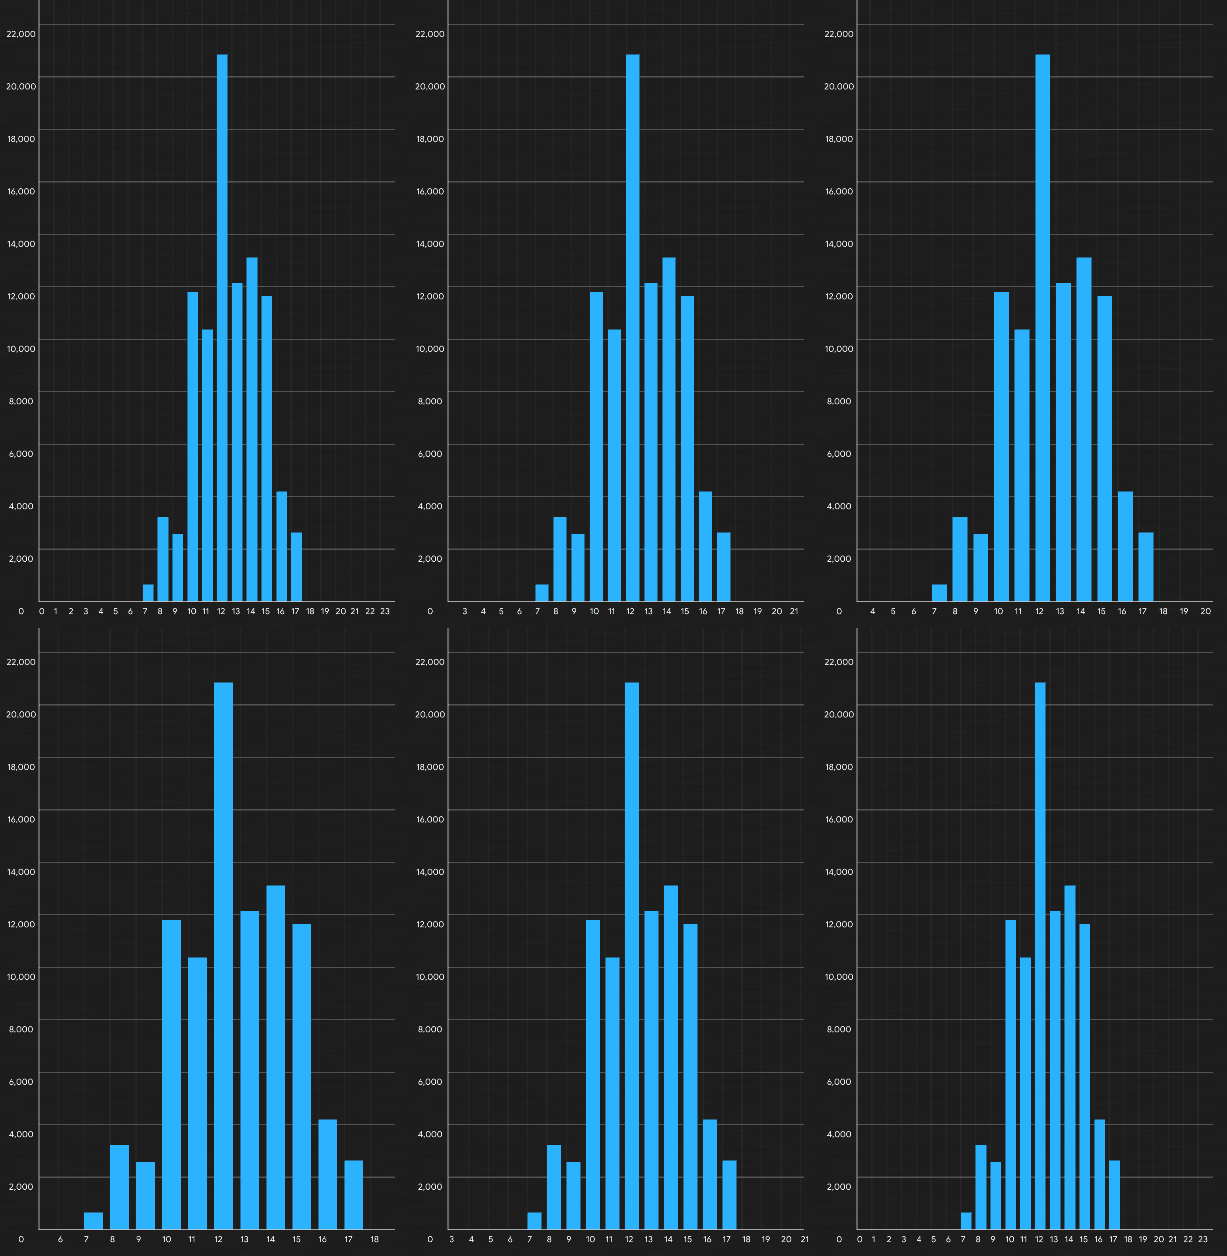
For a more in-depth analysis of the data, you can zoom in by spreading your fingers apart, or zoom out by performing the opposite gesture.

Move forward or backward to analyze the chart data.

Range selector icon: click it to select the time display mode (Day, Week, Month, Year).
How to configure a chart (example project)
Example introduction
This is a step-by-step guide explaining how to configure a Chart component with virtual components, using the EVE-Ghost protocol. You will learn how to configure a Chart from scratch, from parameter settings to viewing the data in the user interface.
Step 1:
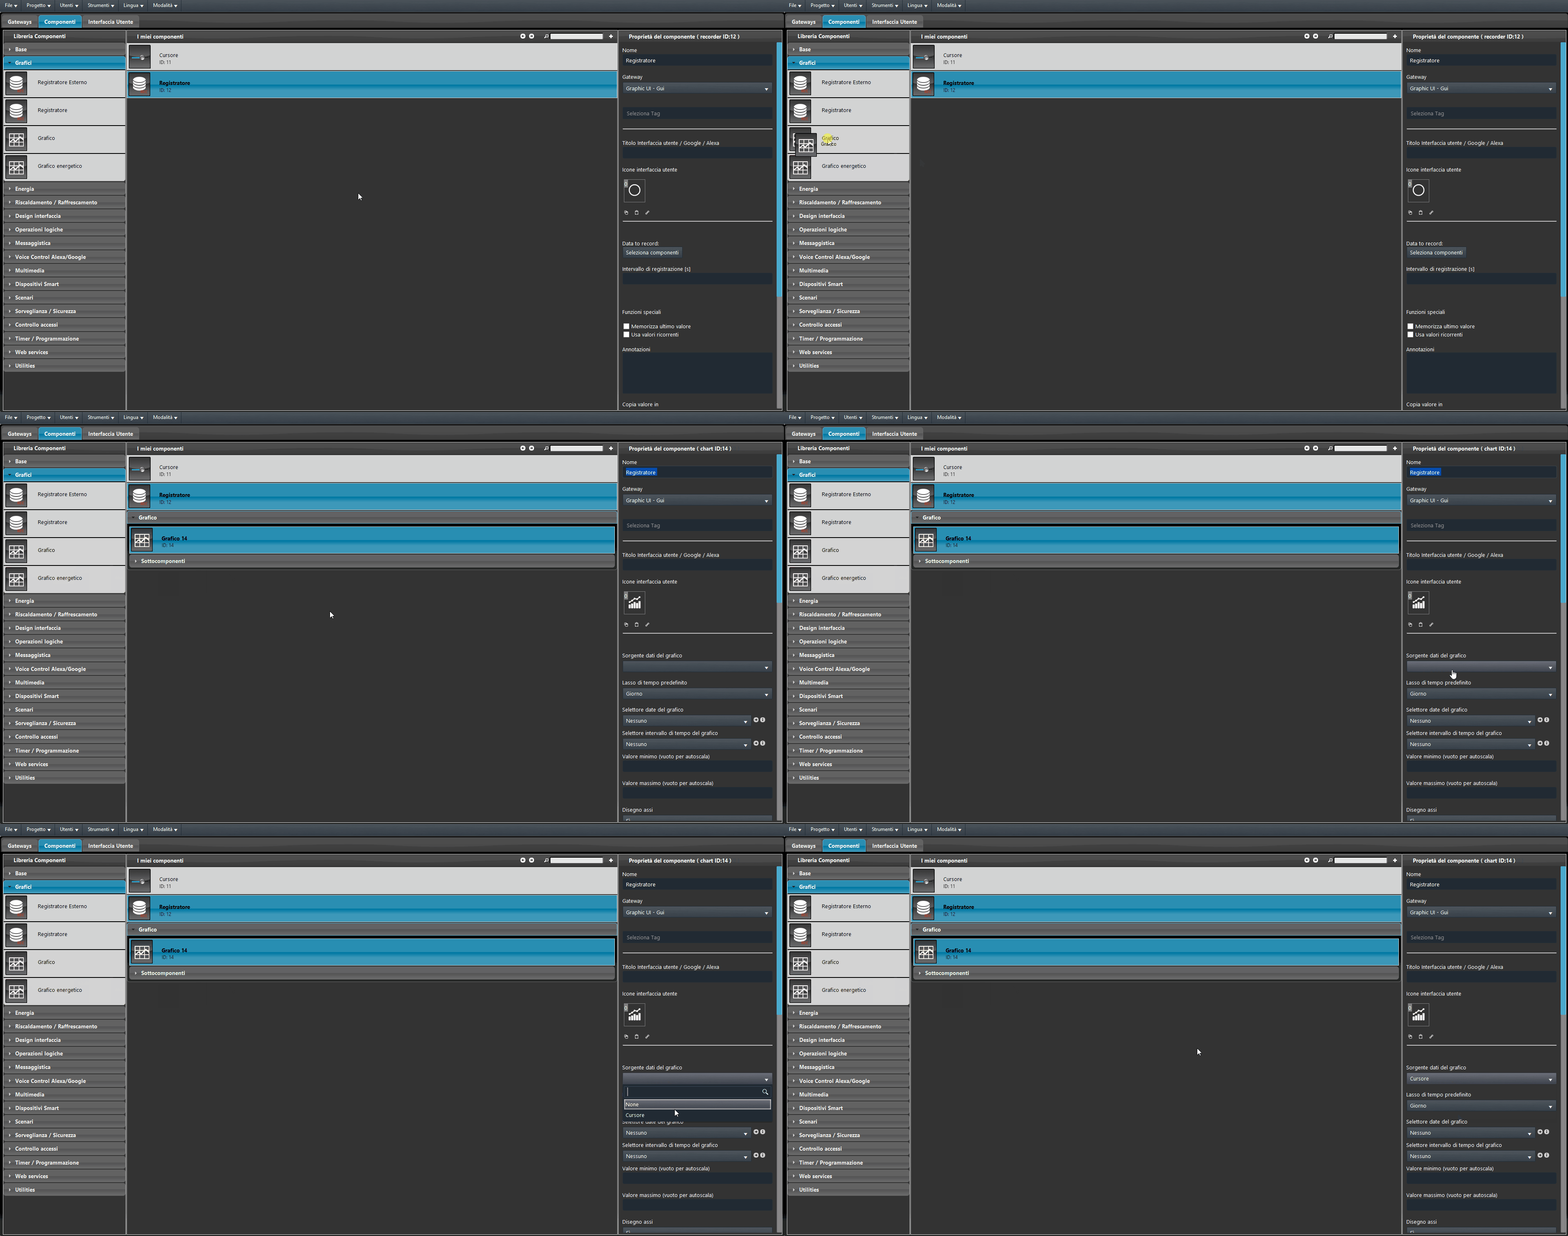
First, add a new Logger component to the project. Then add the component you want to log to the list that opens from the button in the Logger properties, under the data to be logged section. In this example we use the Slider component as the data source.
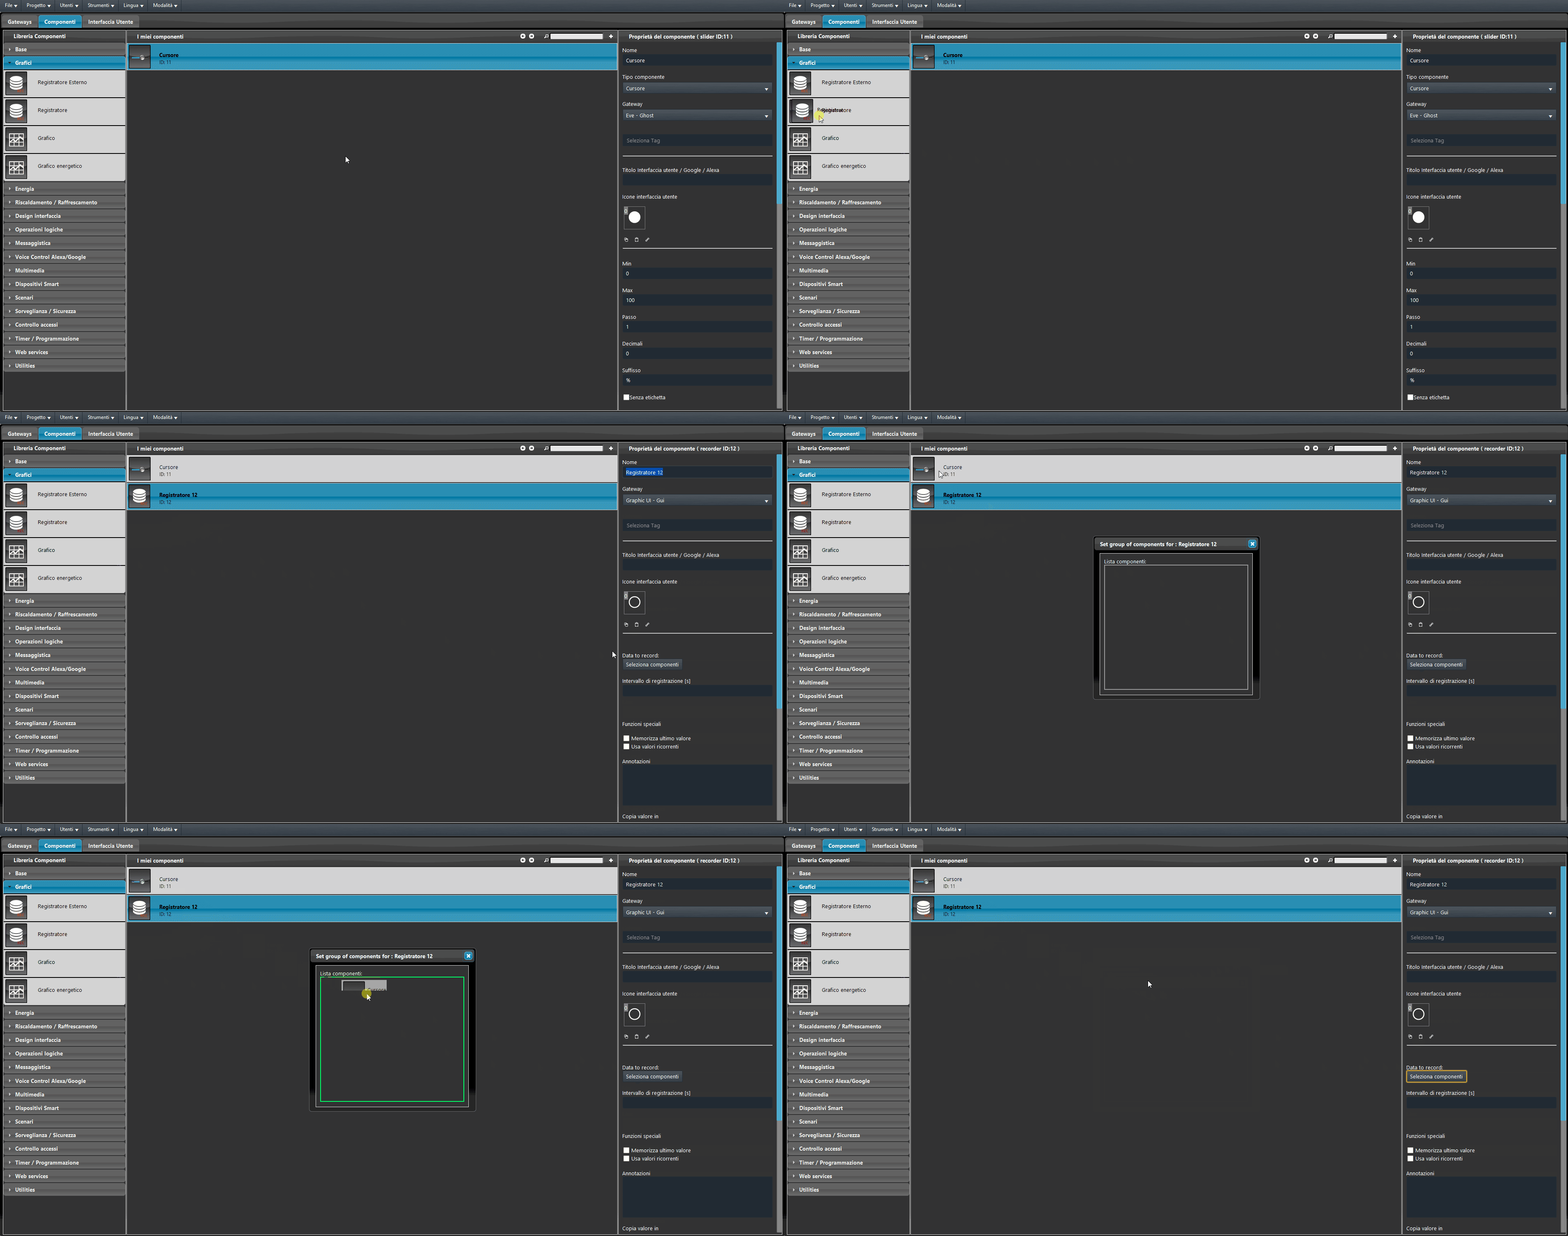
Step 2:
Add a new Chart component to the project, then select the data source from the “Data source” menu in the Chart component properties.
Step 3:
Once the data source has been set, it is possible to add the Chart component to the user interface; in this example we use the Classic user interface. Go to the “User interface” section and add a new icon for the main menu, then add the Slider component (Figure 1). Now also add the Chart component at the third level of the interface editor and finally upload the project to the server (Figure 2).
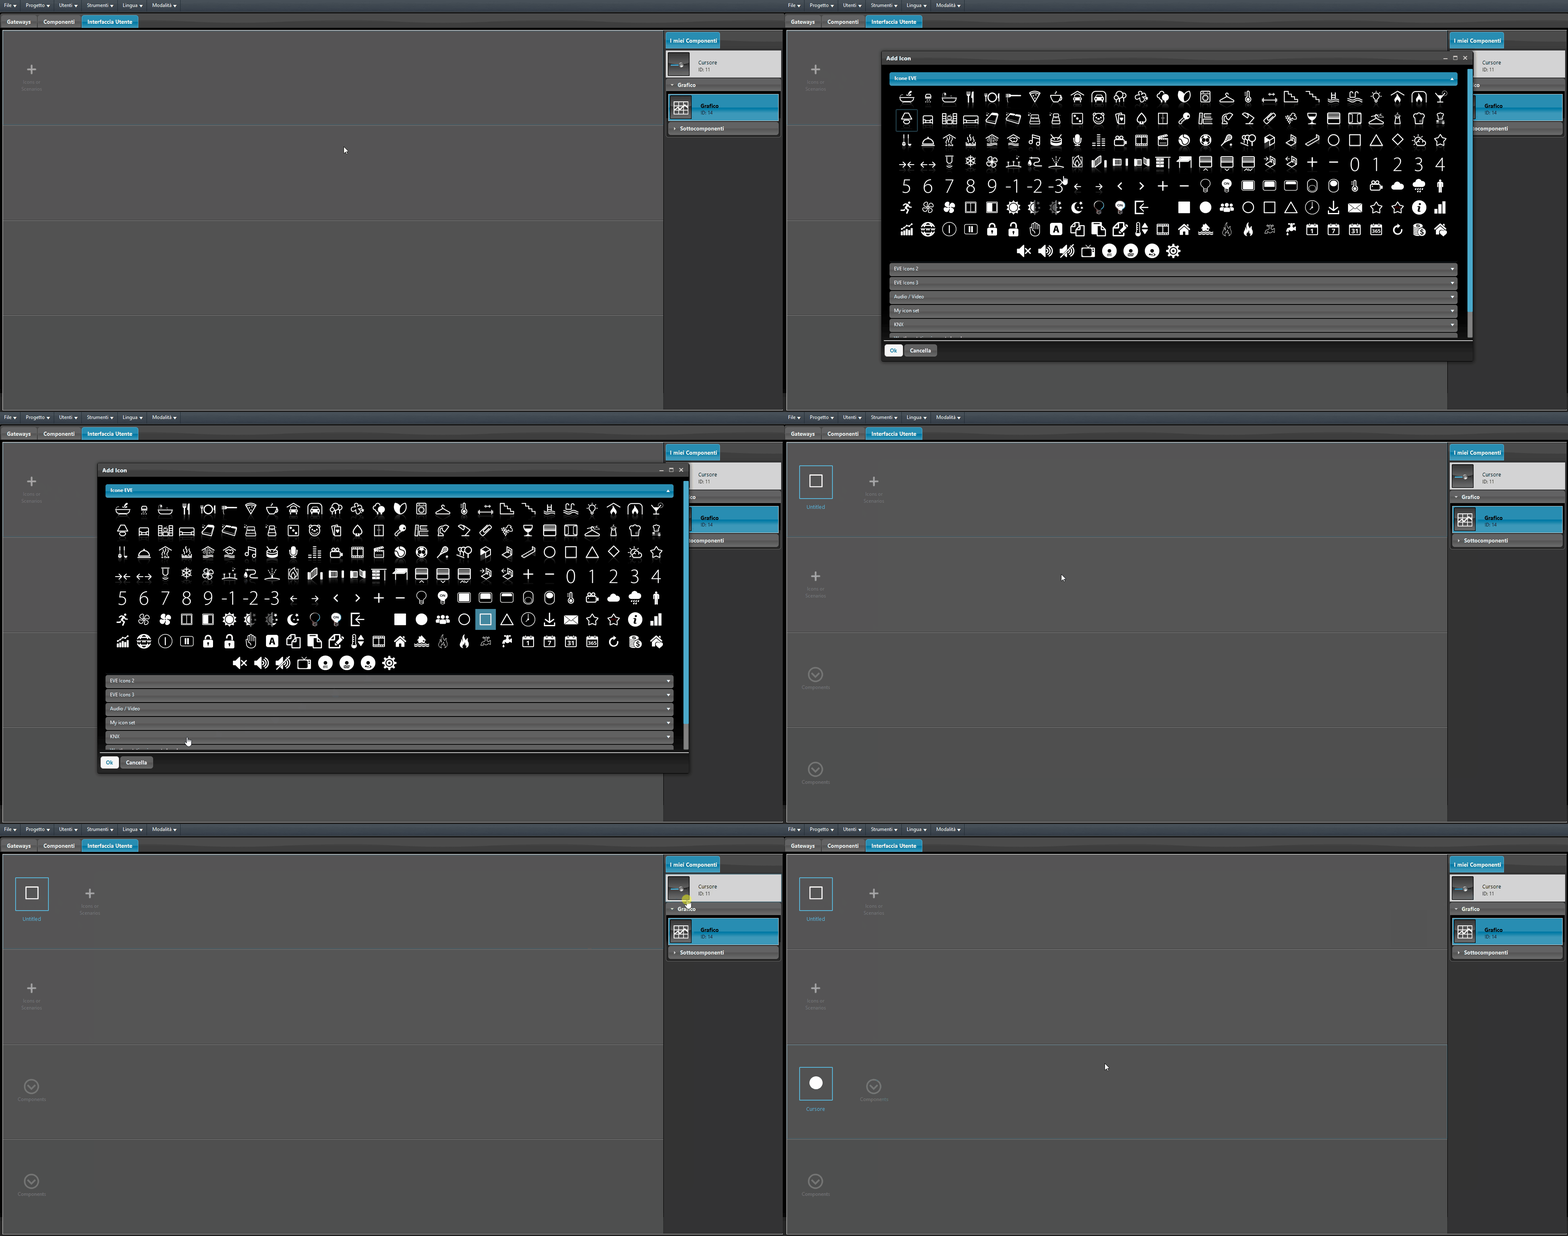
Figure 1
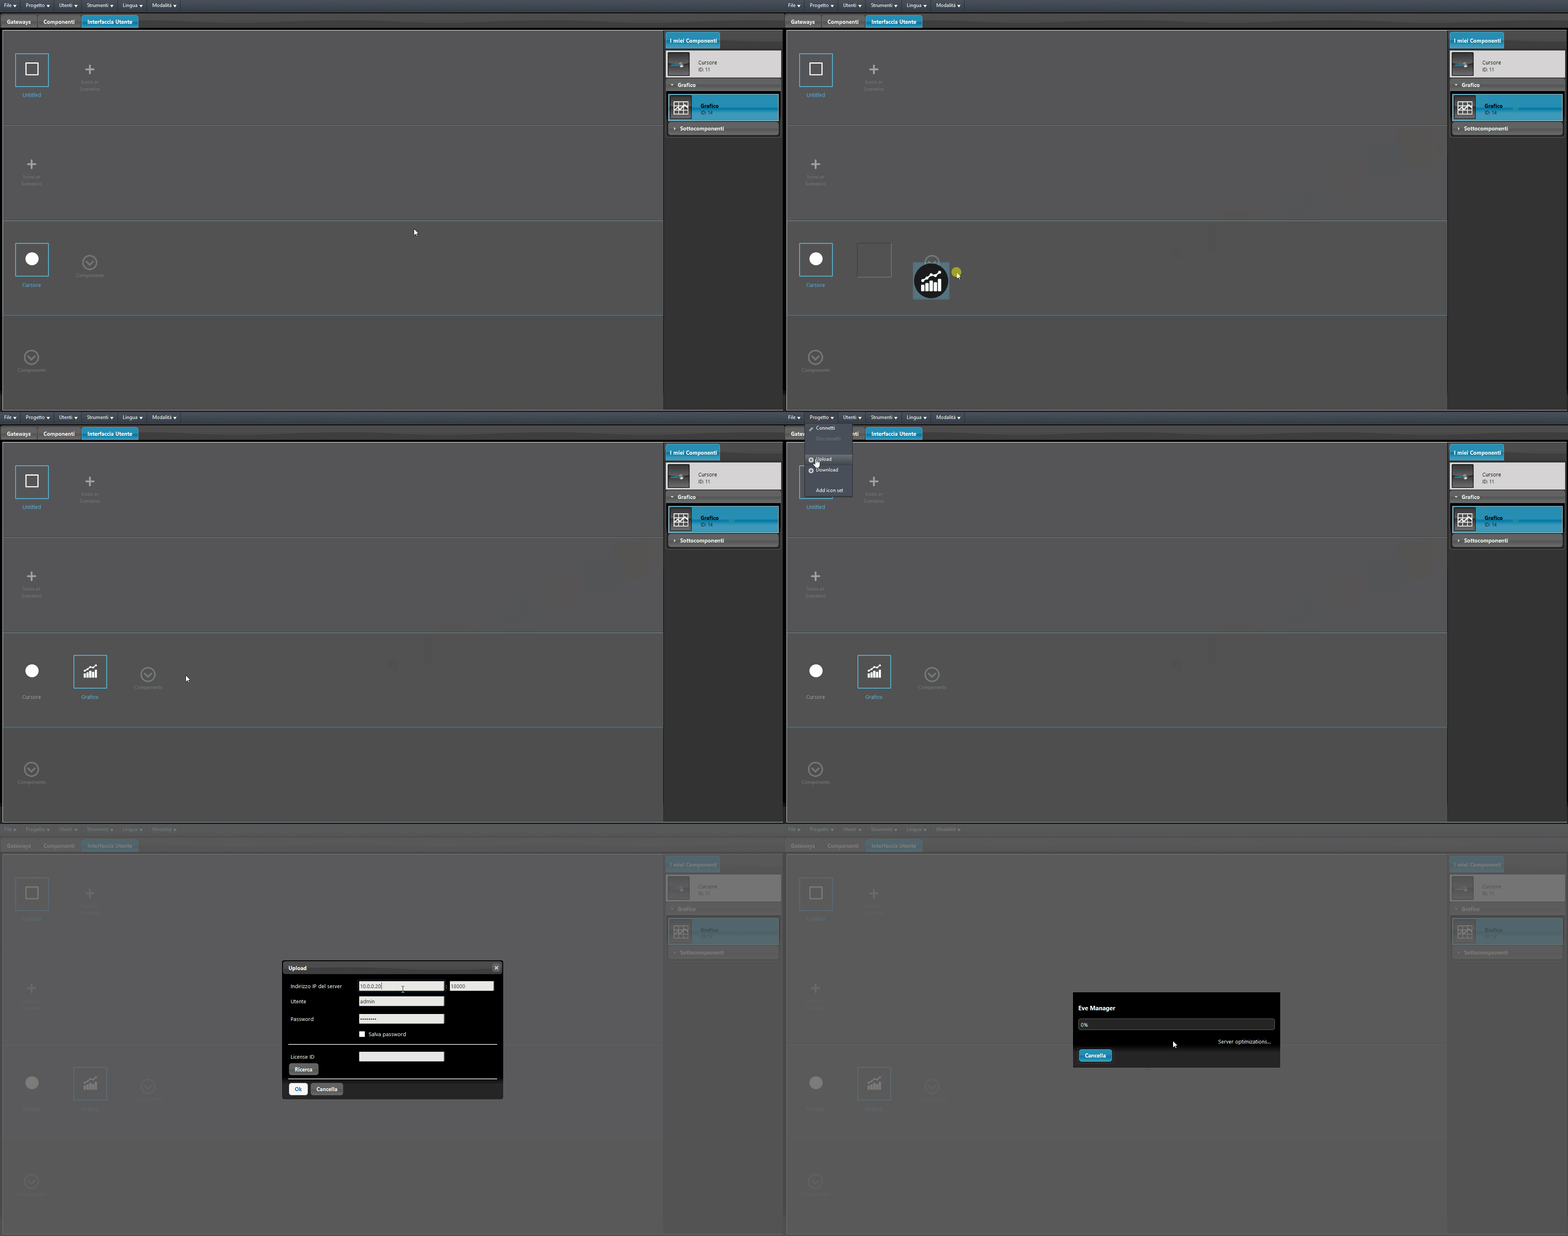
Figure 2
Step 4:
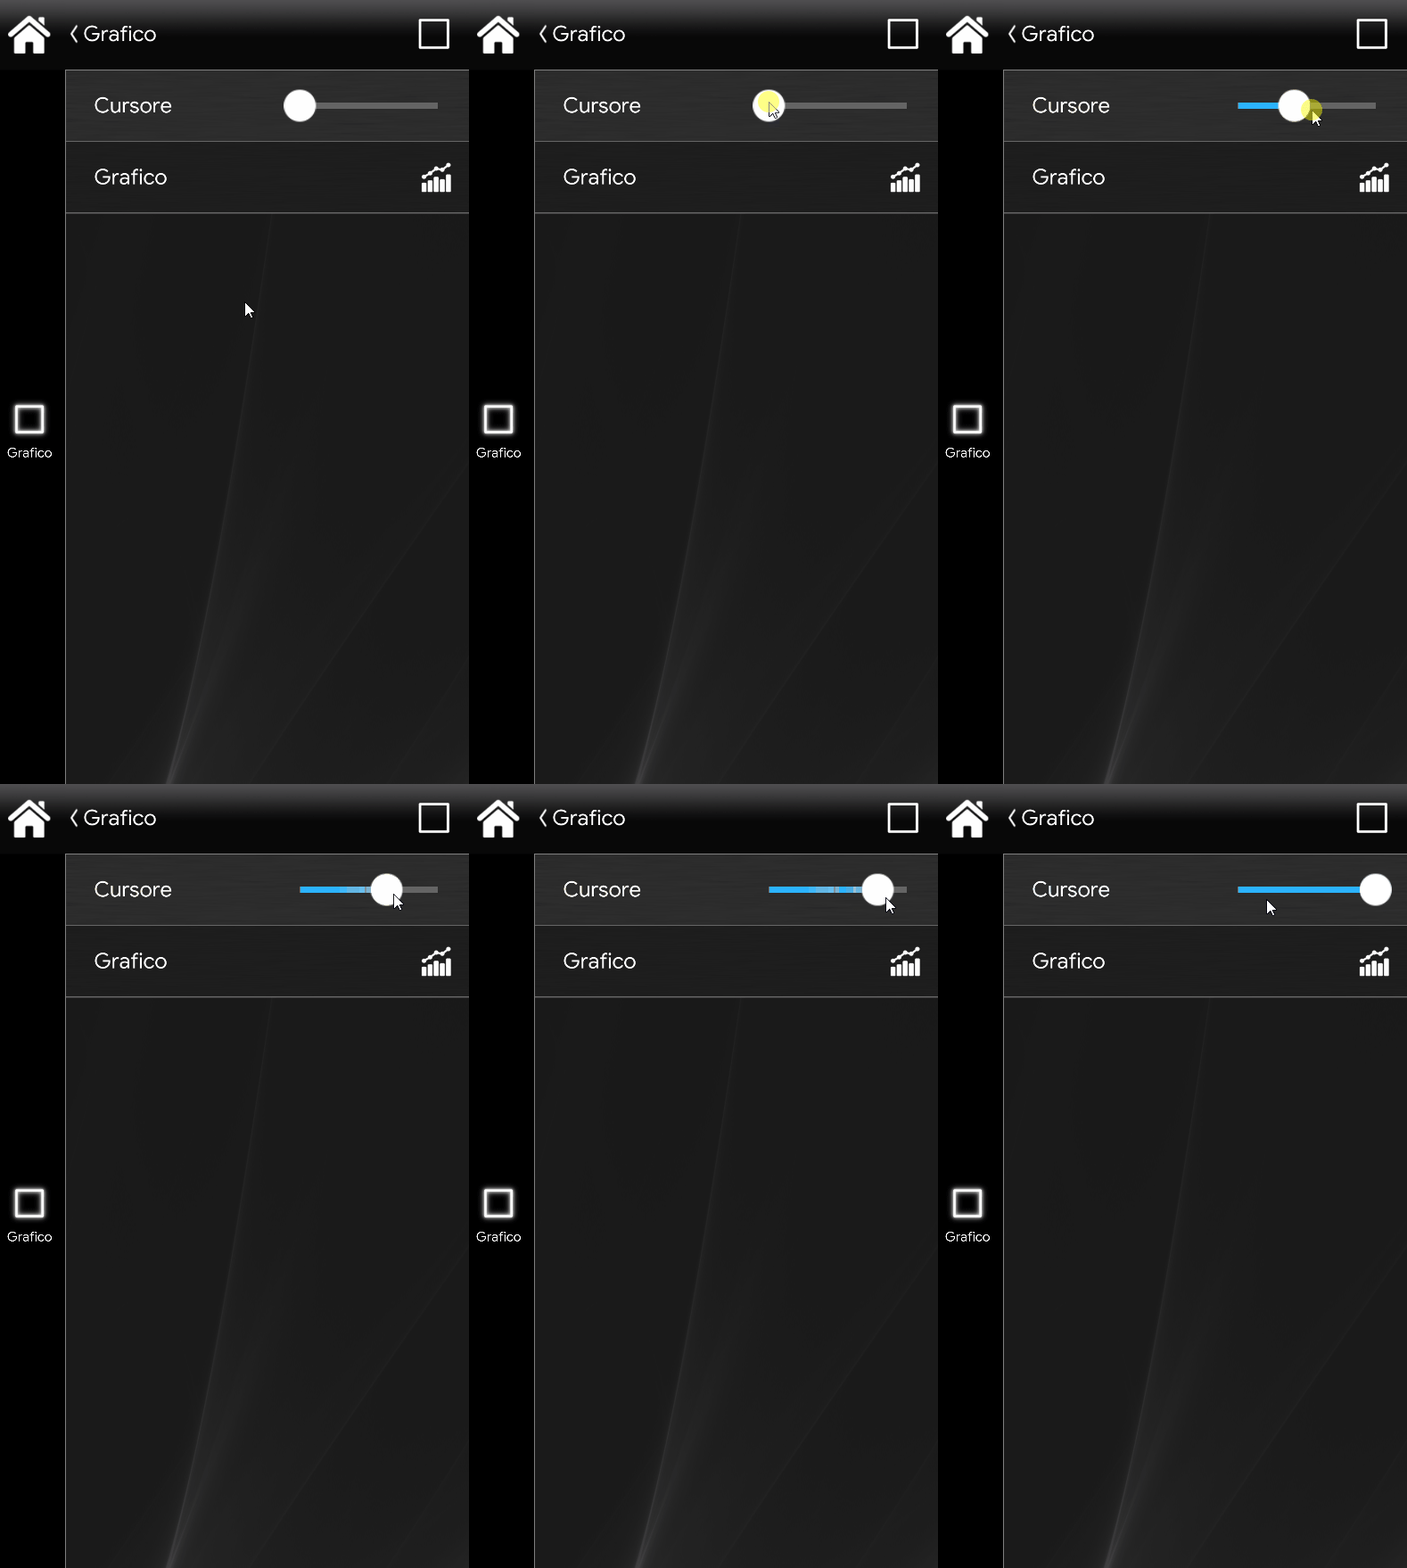
The Recorder component requires the Logic module to be active in order to log data. To display data in the chart, the Recorder must log it: in this example, the data is logged every time the Slider component is moved. In the case of closely spaced records, the recorded data is compared every minute with the data recorded in the previous minute.
Step 5:
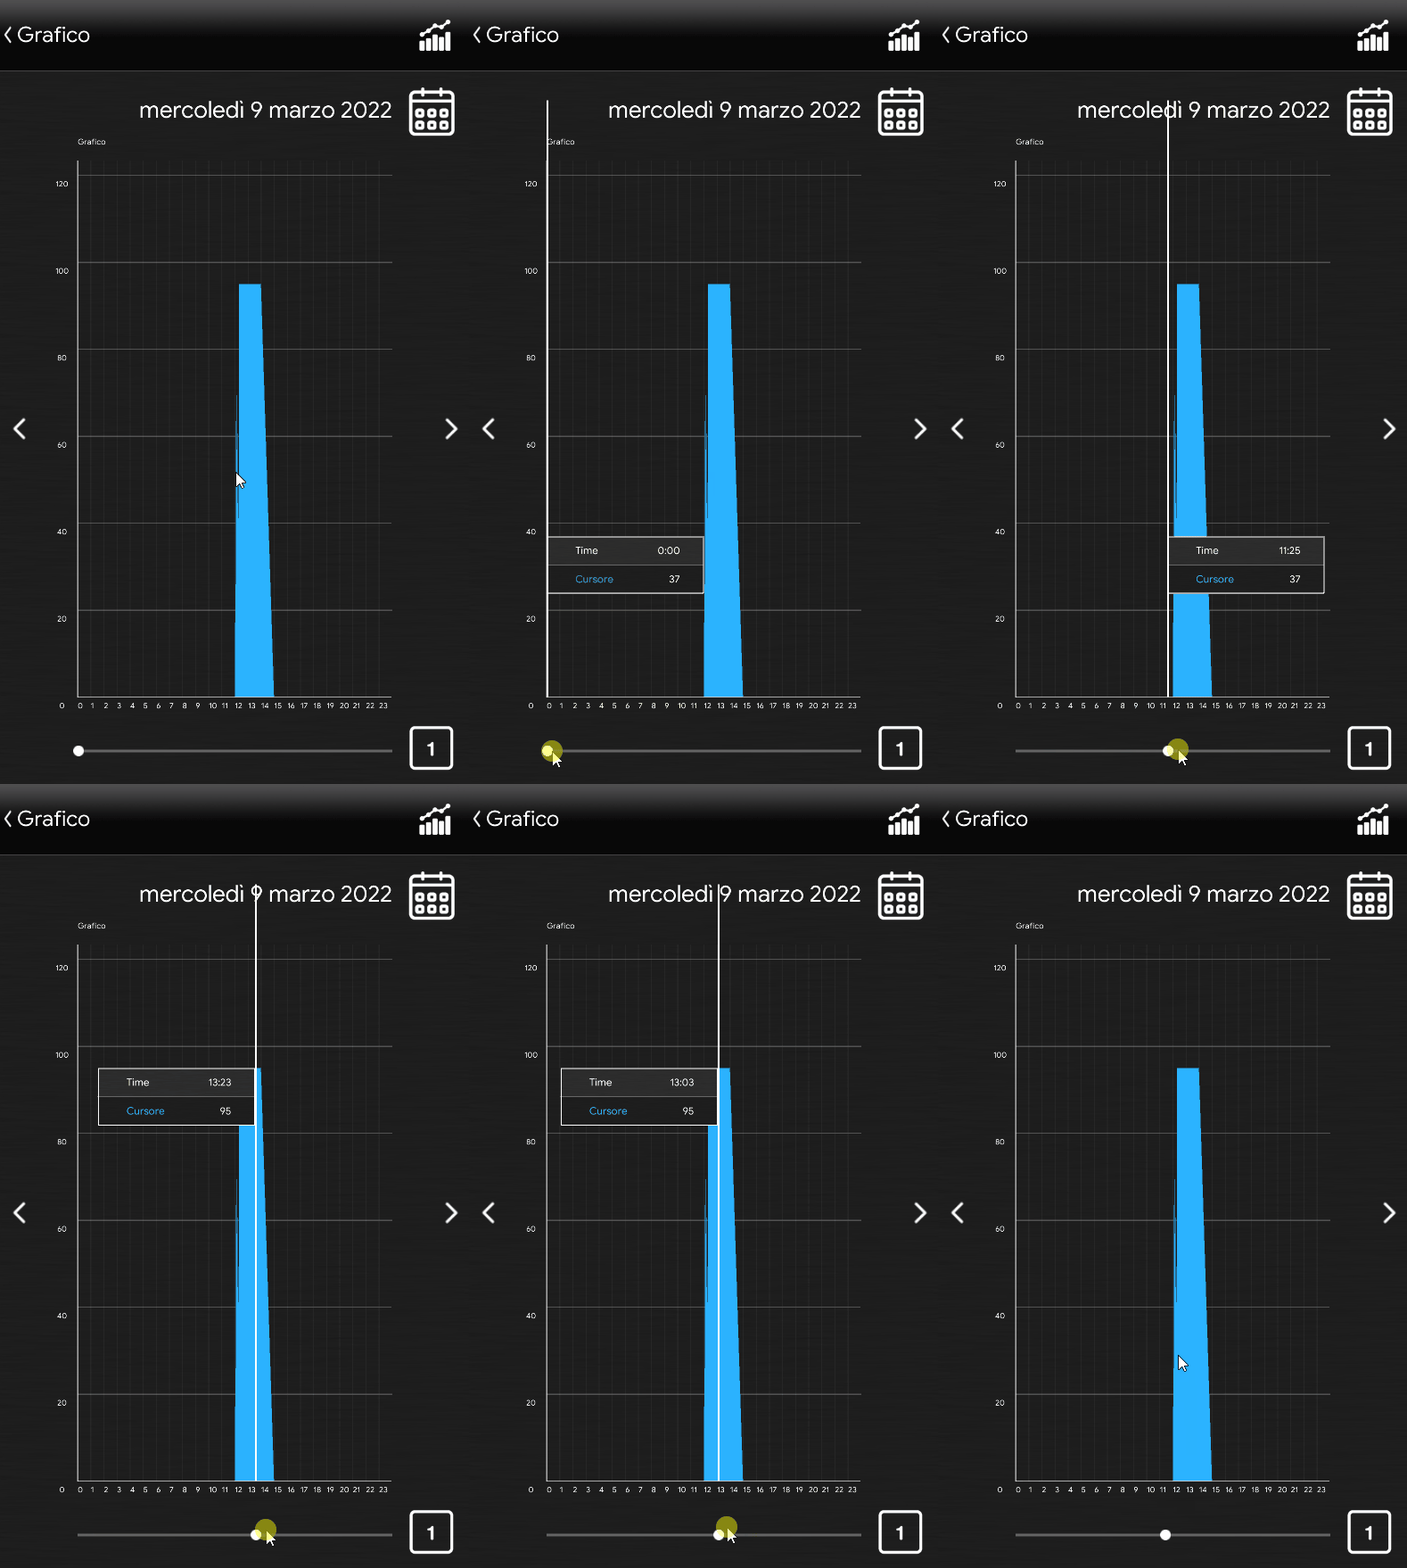
Clicking the Chart icon opens its interface: by moving the slider below, you can browse the displayed data.
Click the link to download the example project and try it out.