History log in Ilevia Control
How to enable and log data directly from the Ilevia Control app using the History chart function.
Introduction
The History log in the Ilevia Control app allows users to view data automatically recorded by the system over time. The information is displayed in a clear, intuitive chart, making it easy to monitor system activity, review past values, and identify trends or changes. This gives users a convenient overview of the system’s historical data without the need for manual logging.
This function is available only for certain component types. The following list shows all components included in this function: Adjustable value, Option list, Info, Colored info, Text info, Lock, Button, Scenario, Setpoint, Shutter, Slider, Switch, User scenario.
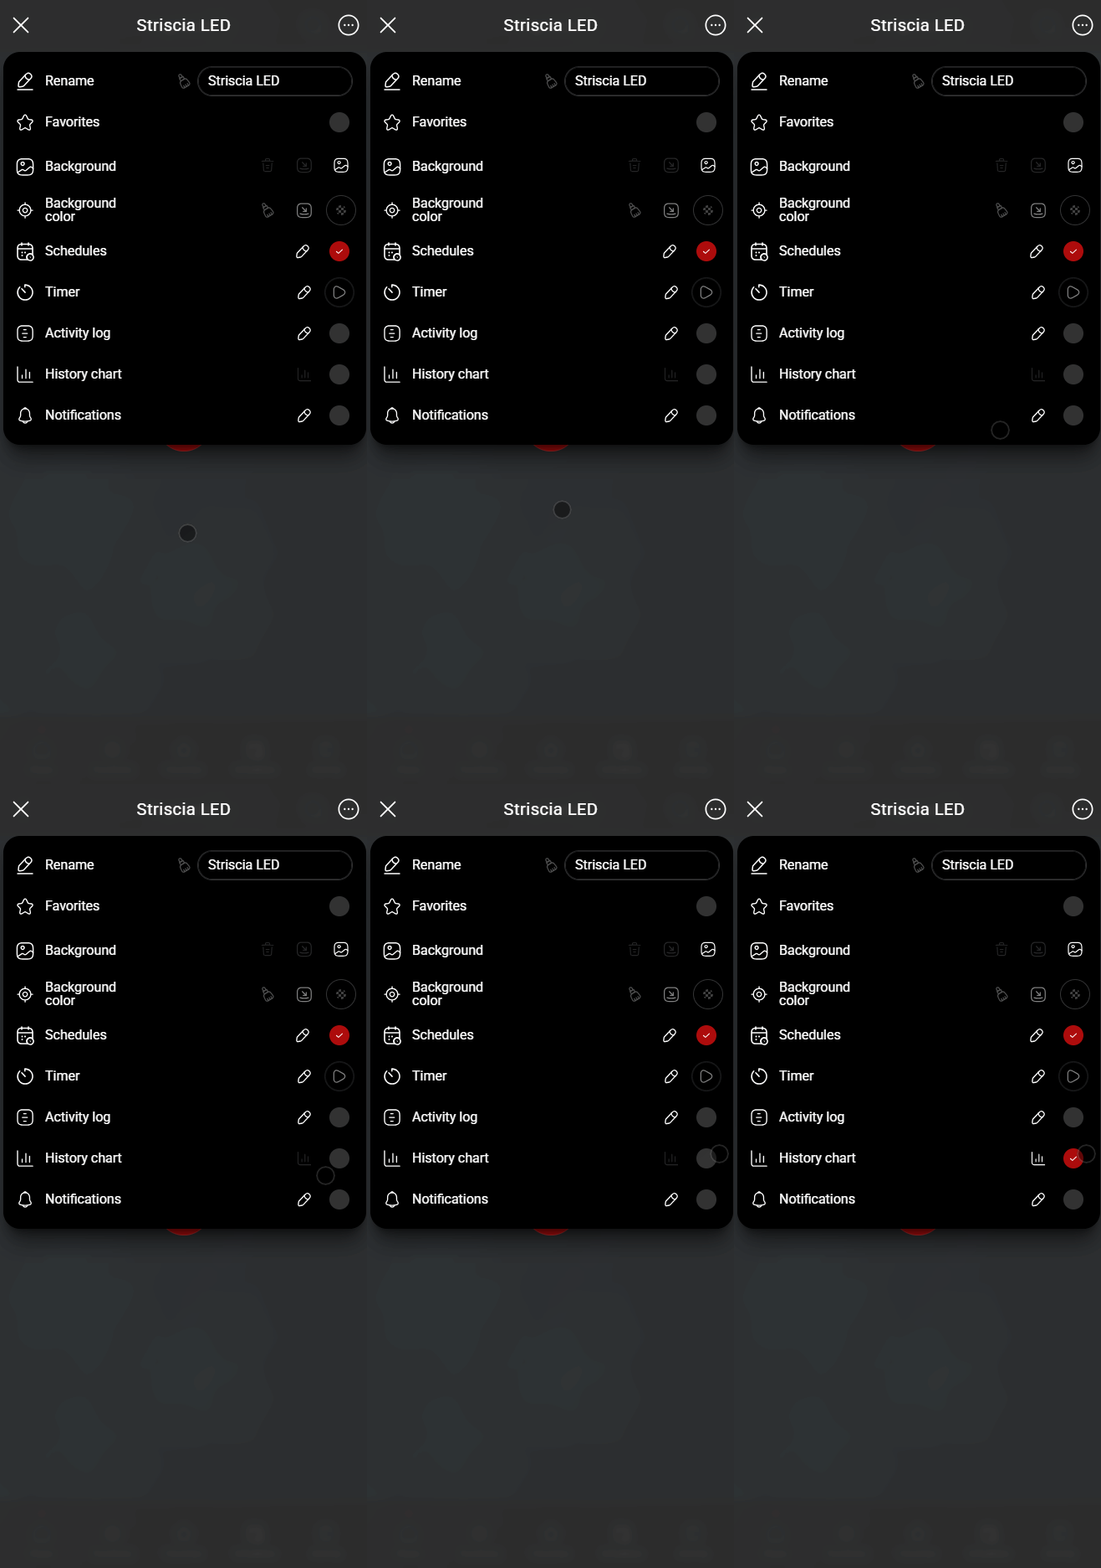
The History chart function must first be enabled to start recording data for that specific component.
Step 1:
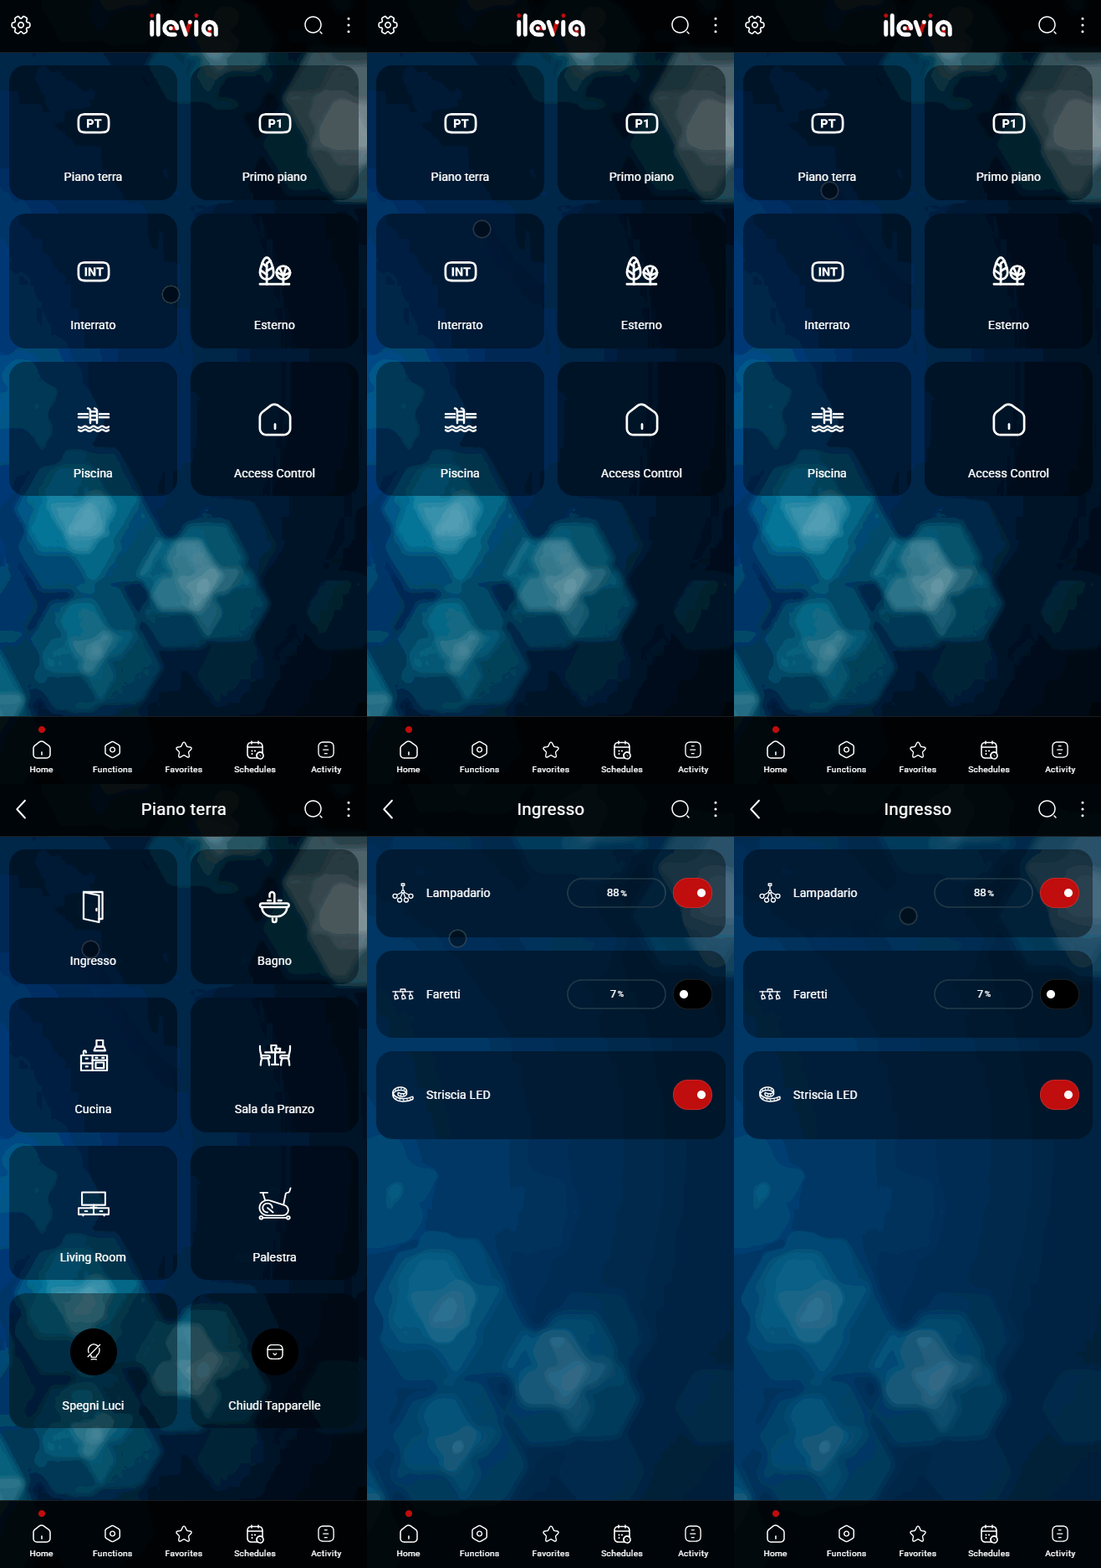
Open your account in the Ilevia Control app and go to the menu containing the component of interest.
Step 2:
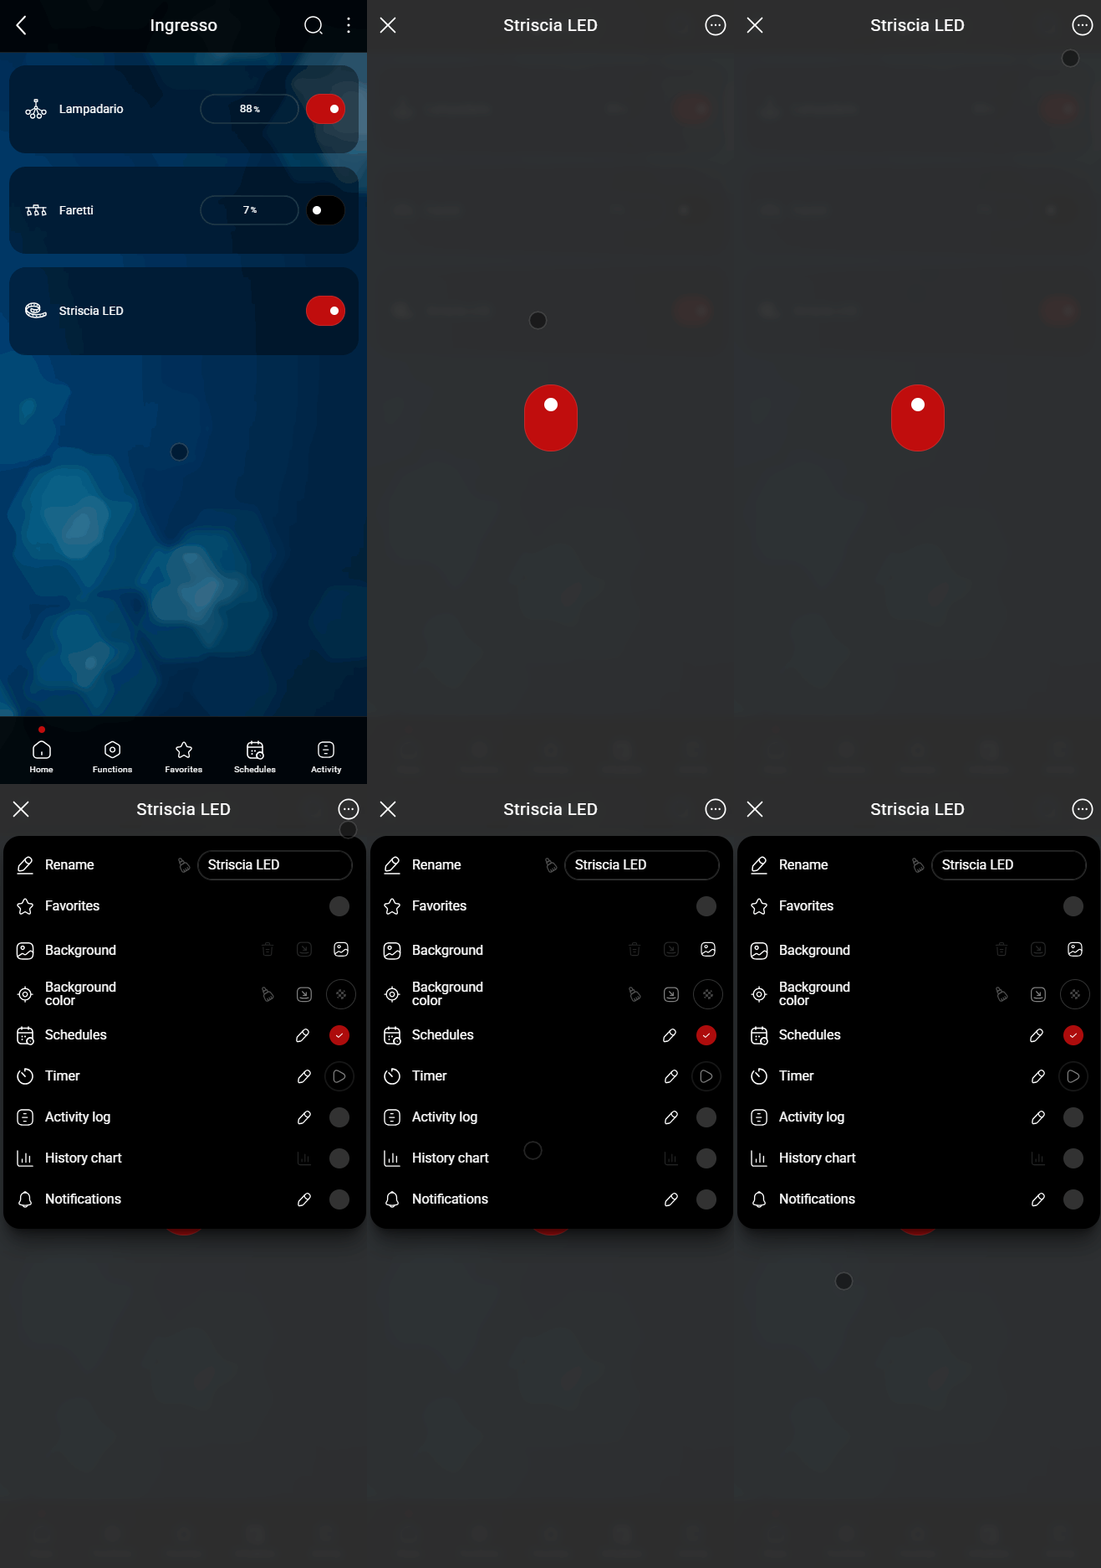
Go to the Component details menu by clicking the component itself, then click the three dots in the upper-right corner of the screen.
Step 3:
Find the setting called “History chart”, then enable it to start logging.
Final result
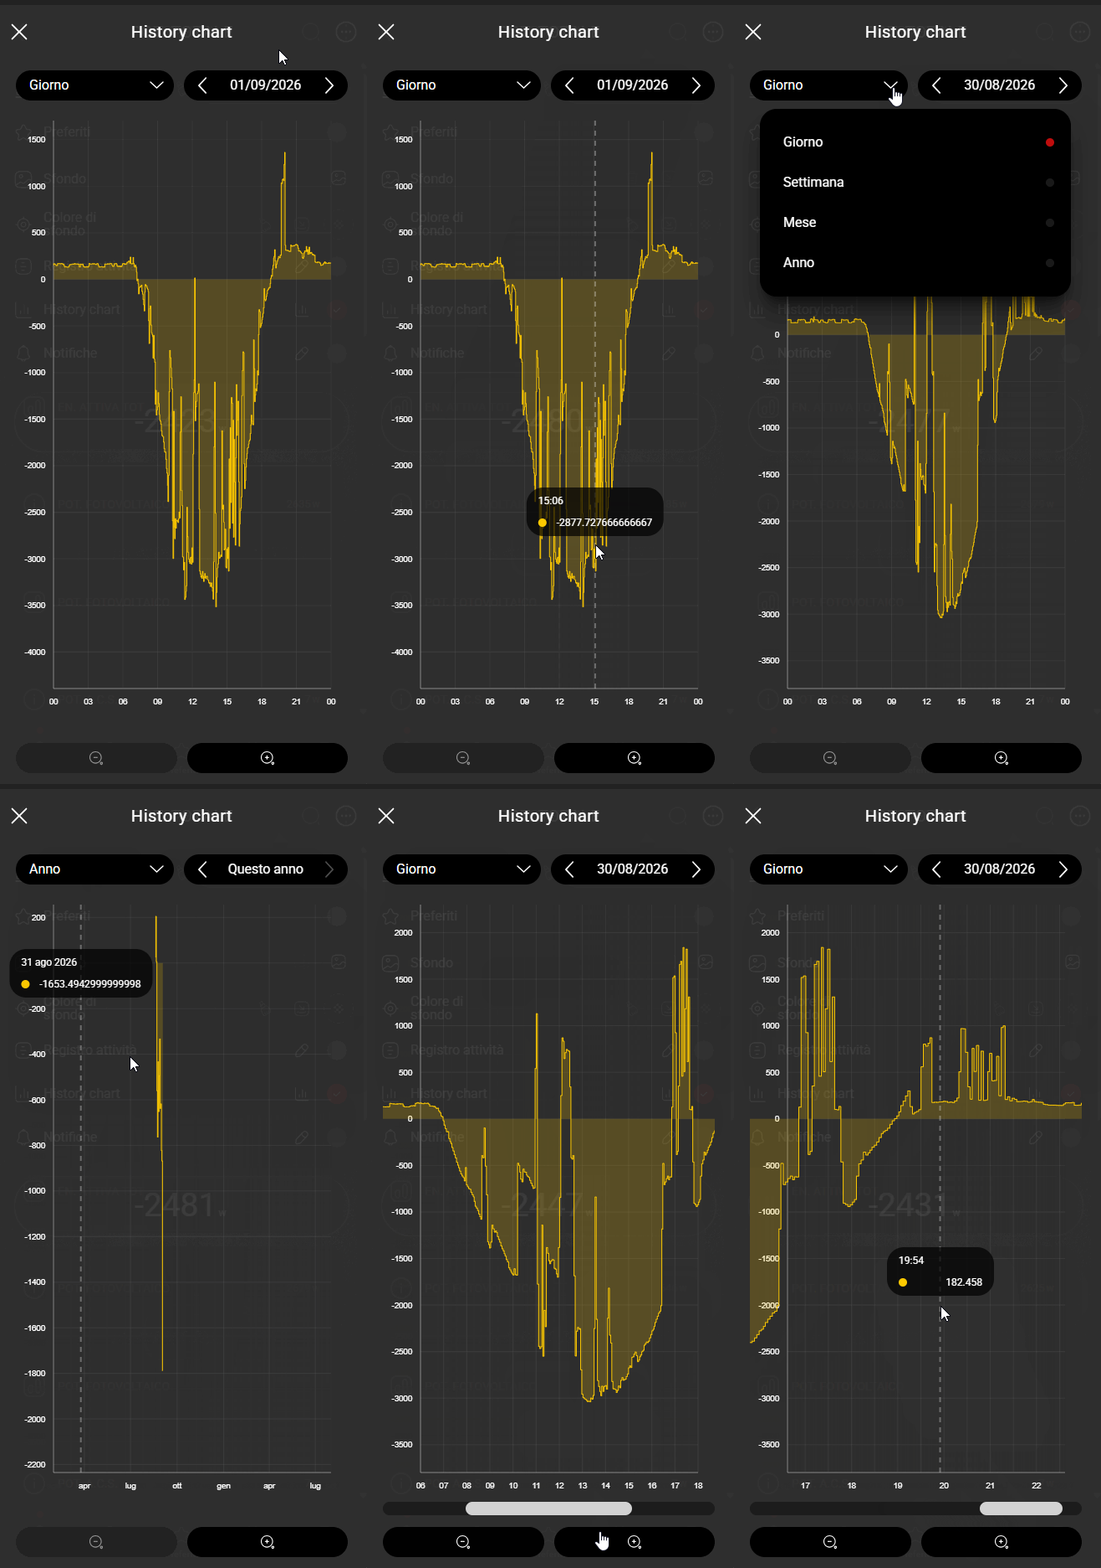
Once logging has started, the data will be displayed in the chart. The data shown in the image below refers to an Info component displaying a value of Total Power. The user, as in the Chart component, can interact with the data within the chart and change the date and the displayed time range (daily, weekly, monthly and yearly).