Report
Complete guide on how to configure the Report component so that you can be updated on specific selected data, and how to set up the .xlsx file.
INTRODUCTION
This component allows you to create reports from logged information and display them in an Excel file. Information from a specific component can be represented in a chart and sent by email on a daily, monthly, or yearly basis.
USE CASES
The user wants to have a weekly, monthly, or yearly report of household consumption.
The user wants to receive a weekly report on the consumption of their home.
CREATING THE REPORT GROUP
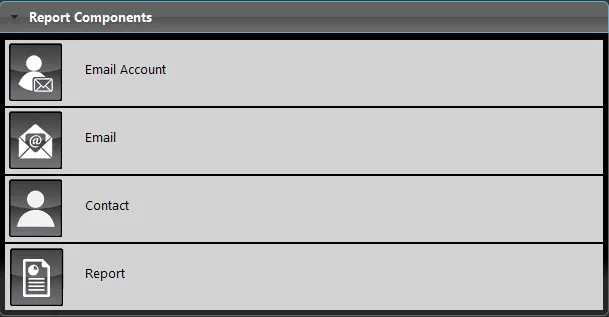
As always, drag the required components from the "Components" area. The special feature of this component is the use of multiple components within a single group to complete the task. As you can see in the image, the required components are Email account, Email, Contact, and Report.
Note:
In this guide we explain only the "Report" component. For configuration of the other components, refer to these guides:
COMPONENT PROPERTIES
The component Title and Icon can be customized. Refer to the “Common properties“ guide.
GUI
This component was created using the Graphic UI gateway.
You can refer to the chapter "Gateway / protocols" for further information.
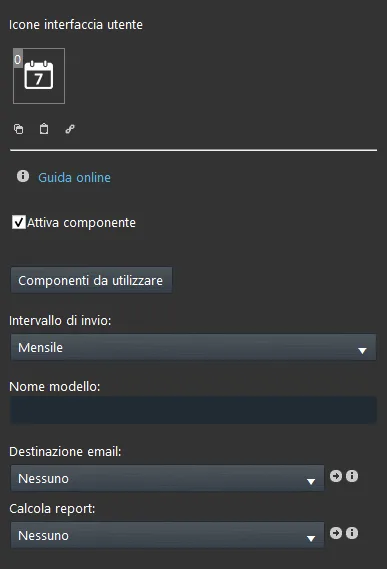
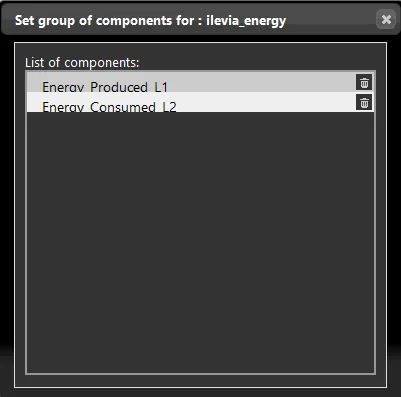
Component to use: defines the data shown in the Excel file; after clicking it, you can drag the desired components into the window (for example the "Info" component);
Send interval: lets you choose whether to send the report daily, monthly, or annually;
Template name: you can use ilevia_energy for an already created template;
Email destination: Select the Email component you configured;
Calculate report: clicking this button, the server compiles the report Excel sheet with the information logged up to that moment.
HOW TO CONNECT TO YOUR SERVER VIA THE SFTP PROTOCOL
You can access your Report with an open-source software such as Filezilla (available for Windows and macOS).
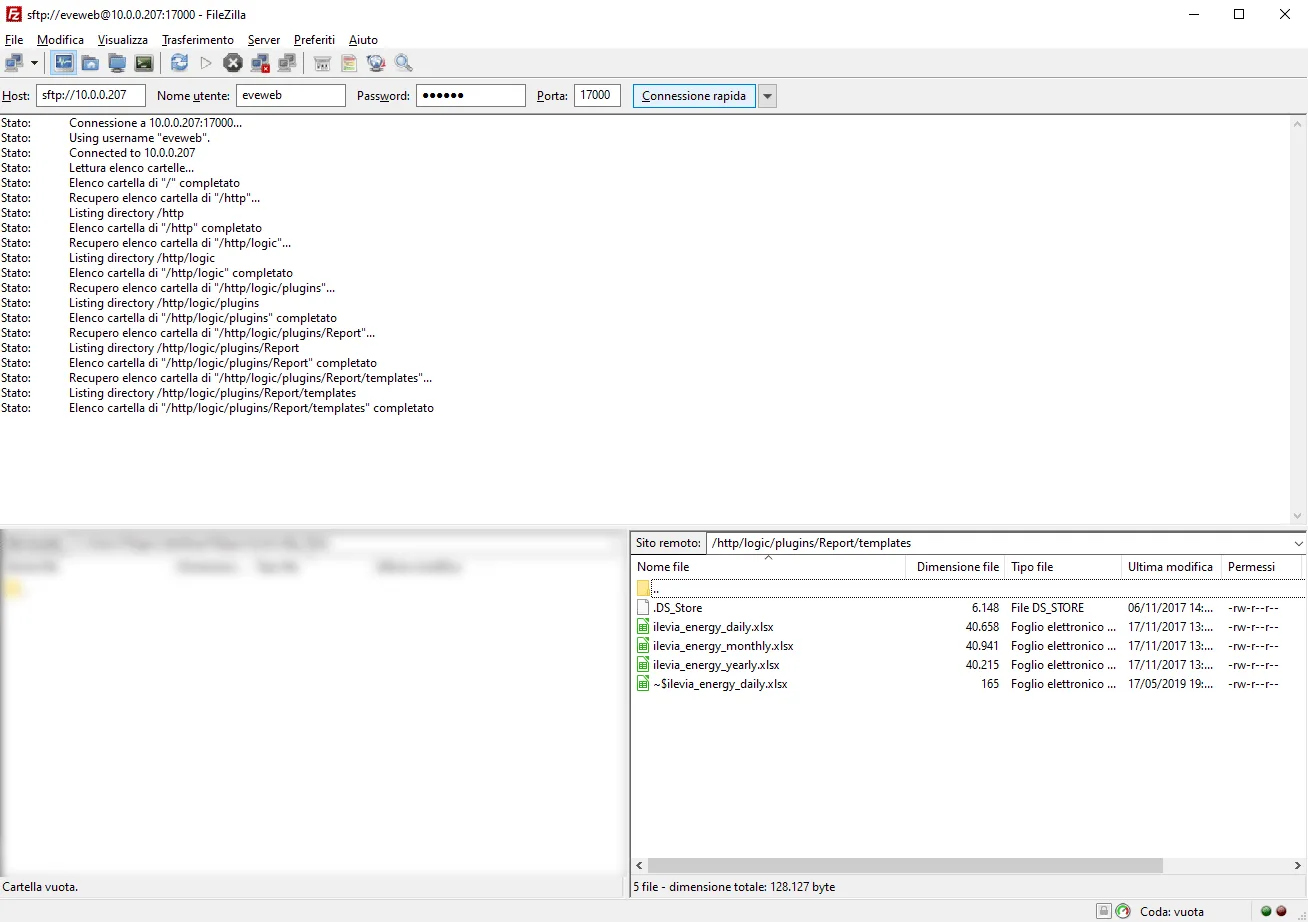
To connect to the Ilevia server via SFTP protocol, enter "sftp://" followed by the IP address of your Ilevia server in the Host text field of the quick connection bar. The Username and Password are both eveweb; enter 17000 as the port number. Finally, click Quickconnect to connect to the server.
Once connected, in the remote site section you will find all the server folders: go to / http / logic / plugins / Report / template and you will find the default template. Double-click the file to download it to the local files.
HOW TO CREATE YOUR OWN DAILY REPORT
In this part of the guide we explain how to customize your report.
Download the file from your server, for example ilevia_energy_daily.xlsx, and you can modify it with your data and your layout. Below are the steps to follow:
Open the file ilevia_energy_daily.xlsx
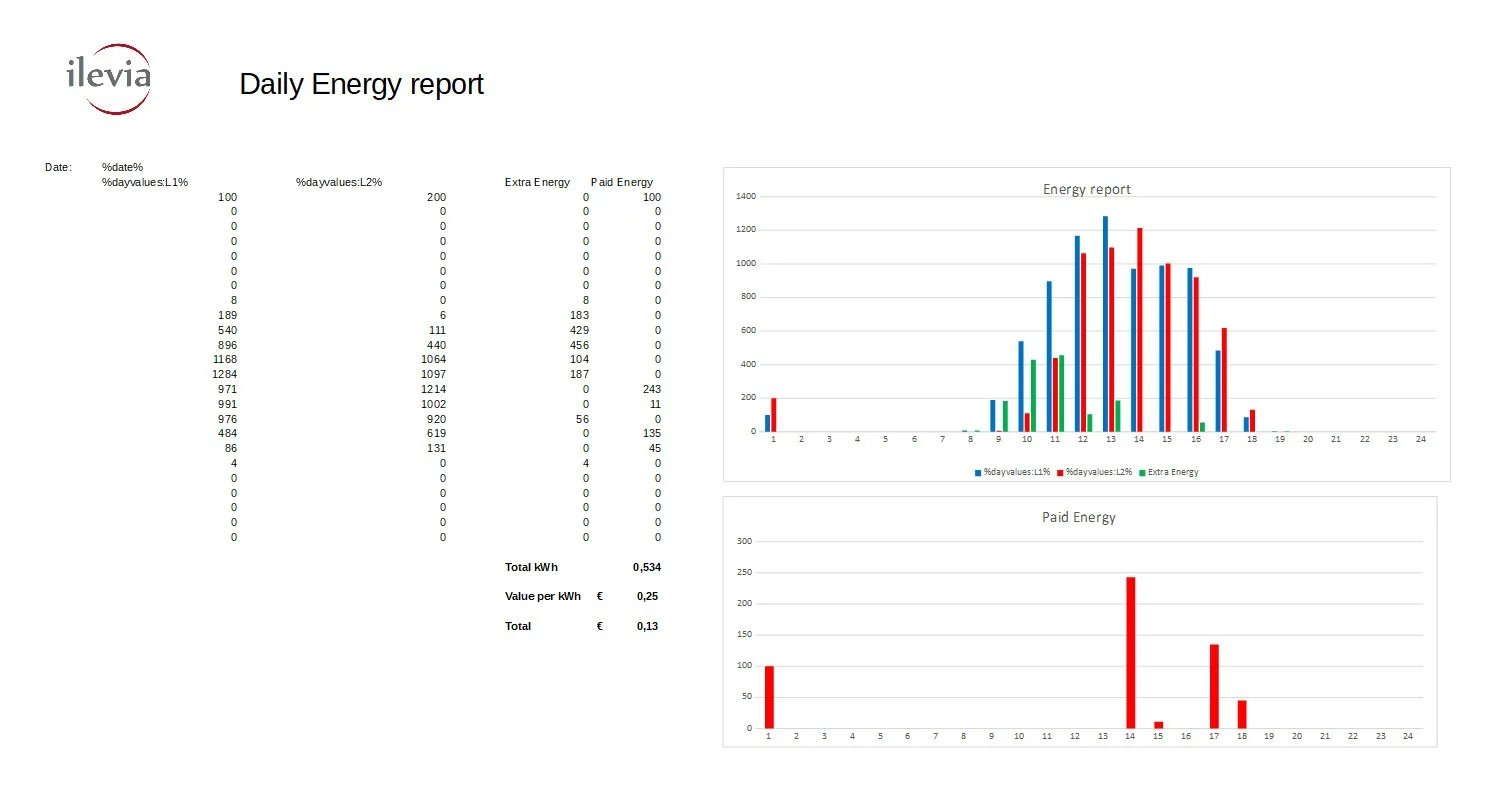
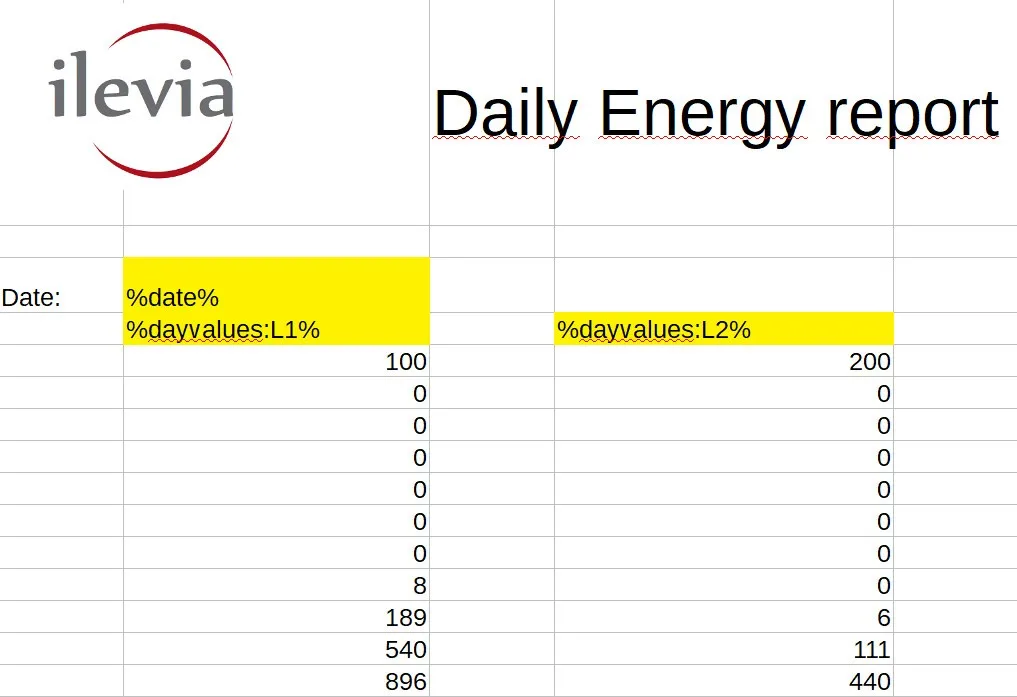
The %date% value shows the date of the day the Report was generated. %dayvalues:L1% shows instead the value of the first component entered in the Report component list. The "Recorder" component is required for data logging: it is important to understand how it works before proceeding. It is important that the Recorder stores data at specific time intervals, which you can set according to your needs.
Remember: you can use a ready-made template to speed up the process (the SFTP file path is http /logic/plugins/Report/templates).
Remember: after modifying the file ilevia_energy_daily.xlsx, upload it again to the server via Filezilla (drag the file into the template folder and overwrite it).
%date%
Is replaced with the date on which the Report was created.
%dayvalues:L1%
The value of the first component in the "Component to use" window (L1 refers to LINE1); the second value is %dayvalues:L2% (L2 refers to LINE2) and so on. In this example, we used the "Recorder" to log the data and two "Info" components to display them. In the other templates the syntax changes depending on the selected time interval: if the interval is monthly the correct syntax is %monthvalues:L1%, while for the yearly interval it is %yearvalues:L1%.
%dayvalues:C<componentID>%
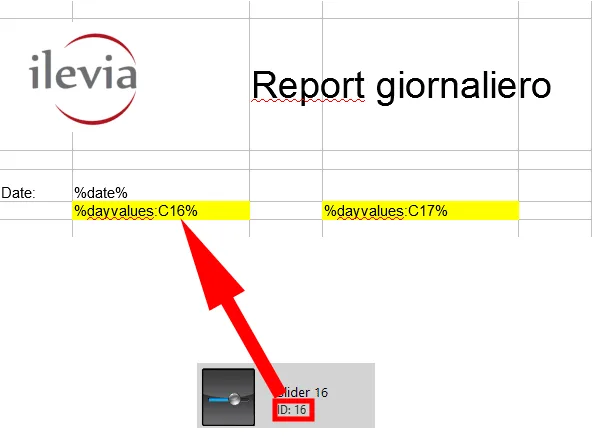
Add the component value inside the list in the Report using the following syntax:
%dayvalues:C<componentID>%
This setting lets you include components in the report calculation without adding them to the Report component list. This system simplifies and speeds up the entire configuration process of the Report itself.
EXAMPLE OF A DAILY ENERGY CONSUMPTION REPORT