
Log
Properties of the Log component in Ilevia Manager and how to download the log file via FTP or from a custom link.
Introduction
This component lets you record what happens in the system. The plugin is similar to Email, but instead of sending a message, it logs the event to a file that you can review later.
Use cases
This component lets you monitor the various state changes of specific components.
This component is useful for keeping track of specific data to export, such as energy consumption/production, or temperatures from sensors and probes.
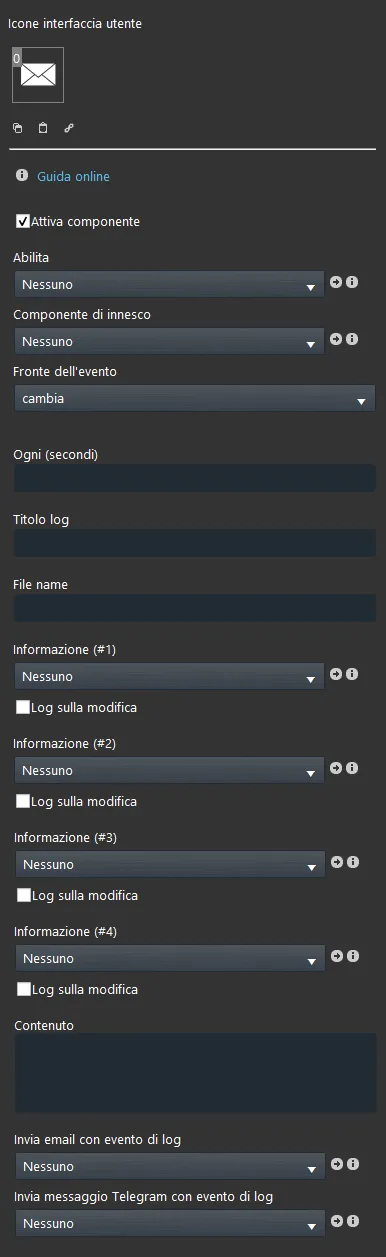
Component properties
GUI
This sample component was created through the Graphic UI gateway.
We recommend reading the chapter “Gateway / Protocols” for more information.
Enable: select the switch to enable or disable log recording;
Trigger component: select a Switch component that will start recording a state. Remember that the log also works without a trigger component;
Event edge: select the edge type that the state must have to be considered for recording;
Every (seconds): time interval used to record the log. Leave it blank if you do not need it;
Log title: enter the title of the information content;
File name: enter the name of the file where the log is saved;
Additional information can be added to the information content (up to 4 items):
Information (#1): Drop-down menu: Colored info, Text info, Info, Switch, Slider, Safe switch or the adjustable value component;
Information (#2): Drop-down menu: Colored info, Text info, Info, Switch, Slider, Safe switch or the adjustable value component;
Information (#3): Drop-down menu: Colored info, Text info, Info, Switch, Slider, Safe switch or the adjustable value component;
Information (#4): Drop-down menu: Colored info, Text info, Info, Switch, Slider, Safe switch or the adjustable value component;
Log on change: if selected, the information is recorded every time the state of the selected component changes. Examples: doors opening or closing, or an energy consumption value changing.
Content: text that will be logged; to insert the information mentioned above, add the # symbol followed by the information number (e.g. #1). If you need to log more components, use this format:
YOURTEXT #1, YOURTEXT #2, YOURTEXT #3, etc.
More than 4 information items at a time: if you need to log more than 4 information items at a time, the procedure is as follows:
In the Content text field (Content) add the parameter “##COMPONENTIDFORLOG##”: in this way you can add to the log all the parameters you need.
Remember to use “,” at the end of each item: it will separate and format the text correctly inside the .csv file.
Send email with log event: select an Email component to send email messages when the trigger component changes state.
Send Telegram message with log event: select a Telegram component to be activated at each log event.
Example of CSV file view

Example of .csv file
This is an example of a log that checks whether a door has been opened or not. As you can see, it records the state change of a component and the exact time when it occurred. If you want to export the file in .csv format, add the .csv extension in the “File name” text field in Ilevia Manager.

Log time
In the server “logs” folder, two logs are stored: a daily one called “today_YOURFILENAME” and a folder with the date (YY/MM) containing all logs for the month; this helps organize the log files.
Reminder before continuing:
Download and install the Ilevia Logic plugin to enable plugins (link);
After uploading the project to the server, wait a couple of minutes for the logic to activate.
How to download the log file
Below is the procedure for downloading the log file:
1. Download an FTP program to access the server, for example Filezilla;
2. Once installed on your computer, start the program and open the site manager from the top-left menu “File – Site Manager”;
3. A screen will open: click “New Site” and fill in the fields: Host (the Ilevia server address), Logon Type “Normal” and, for user and password, enter “eveweb”. Once the fields are completed, click “Connect”;
4. On the left side you will see the folders on your computer and, on the right side, those on the Ilevia server;
5. Follow this path on the Ilevia server: http/logic/plugin/log/logs, then open the current month folder;
6. Locate the desired log file;
7. To open the file, install LibreOffice or Microsoft Excel on your PC if they are not already installed, then right-click the file, choose “Open with” and select LibreOffice Calc.
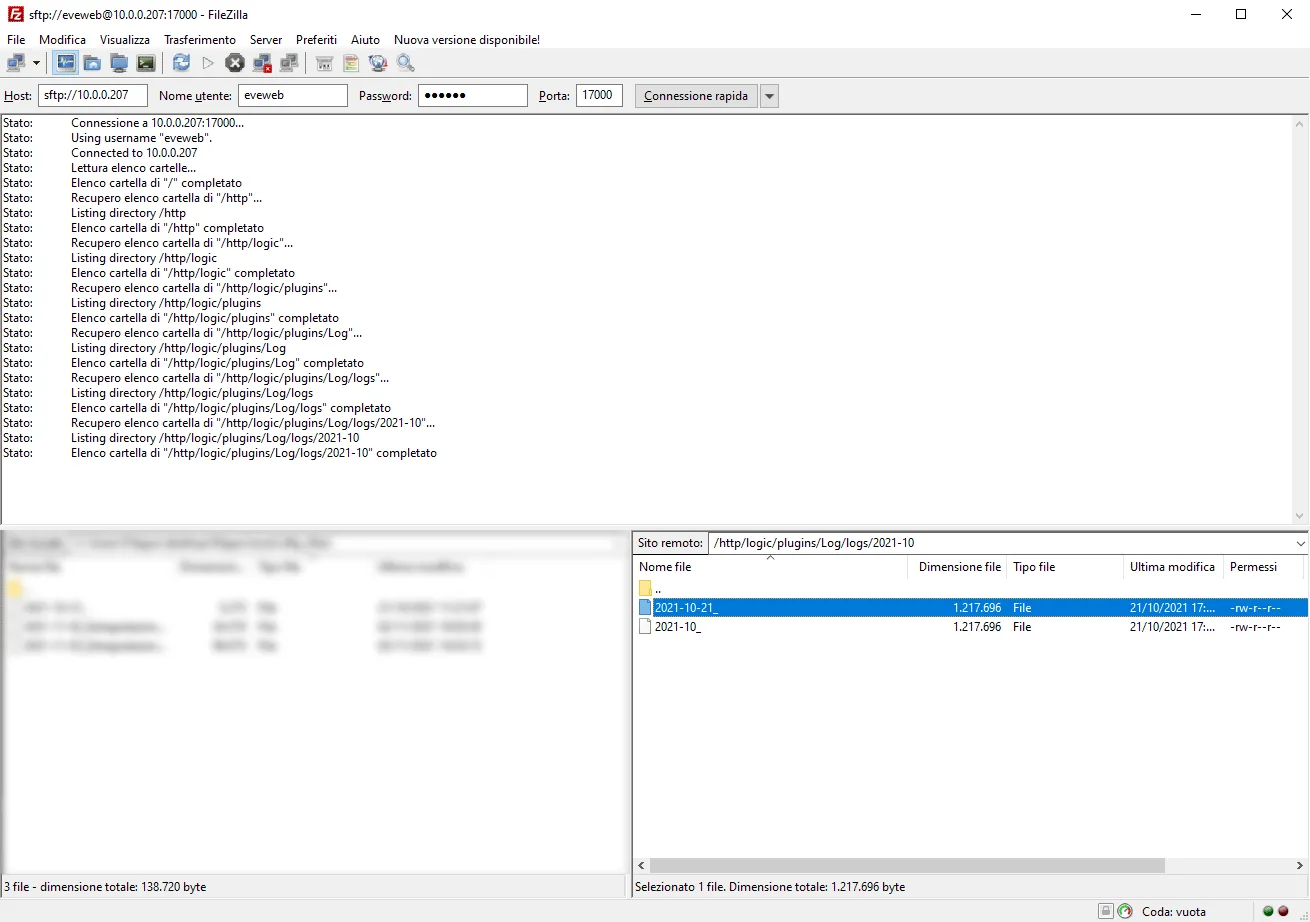
Alternative ways to download the log file
You can also download the log file through a link associated with the component in the user interface, which takes you directly to the download page.
This is an example of a download link:
http://indirizzo_IP_del_tuo_server/logic/plugins/Log/logs/last_sensors.txt
How to choose the time interval to display in the web browser:
Current day: http://indirizzo_IP_del_tuo_server/logic/plugins/Log/logs/today_nomefile;
Current month: http://indirizzo_IP_del_tuo_server/logic/plugins/Log/logs/current_month_nomefile;
Last recorded value: http://indirizzo_IP_del_tuo_server/logic/plugins/Log/logs/last_nomefile.
Download the demo project for the Log component and try it yourself.