Bar chart
How to set up the Bar chart component in Ilevia Manager and how it is displayed in the Ilevia Control app.
INTRODUCTION
The component represents a value with histograms or speedometers, in a colored bar layout. Some options define how the value is displayed.
USE CASES
You can use this component, for example, to keep track of the current produced by your photovoltaic system.
COMPONENT PROPERTIES
GUI
This component was created using the Graphic UI gateway.
For more information, see the chapter “Gateway / protocols”.
Components:
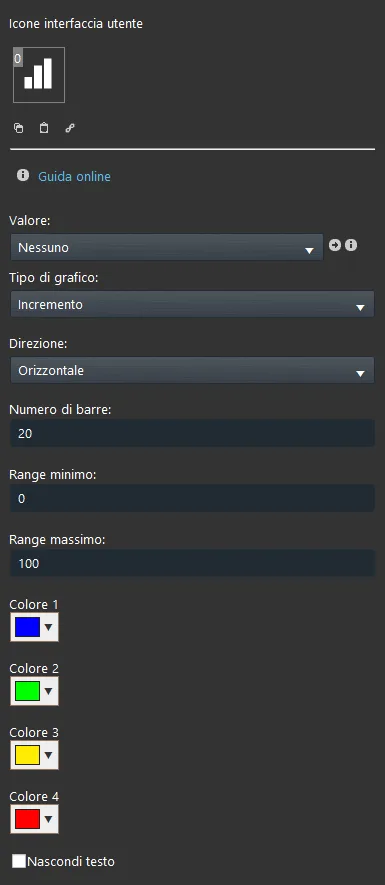
Value: Select the Info, Dimmer, Browse, Slider, Adjustable value or Set point component you want to display in the chart;
Parameters:
Chart type: Choose the chart type among square, circular, with increasing value or decreasing value (see the graphic template examples below);
Direction: Choose the direction in which the value increases;
Number of bars: Defines how the bars will create the chart;
Minimum range: Minimum chart value;
Maximum range: Maximum chart value;
Color: You can choose the color of each individual bar in the chart (left button above the palette). You can use multiple colors to create and adjust the chart according to your preferences;
Hide text: This checkbox lets you decide whether to show the value of the component linked in the Value parameter or not.
Classic view
Here is the visual result in the Ilevia Control app interface (classic style). You can change the size of the bars according to your needs.
You can add as many bars as needed in the same user interface.
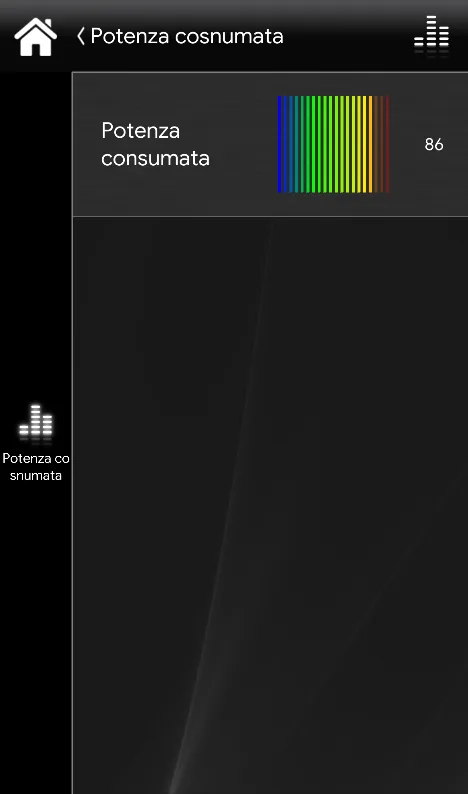
GRAPHIC TEMPLATE: SQUARE
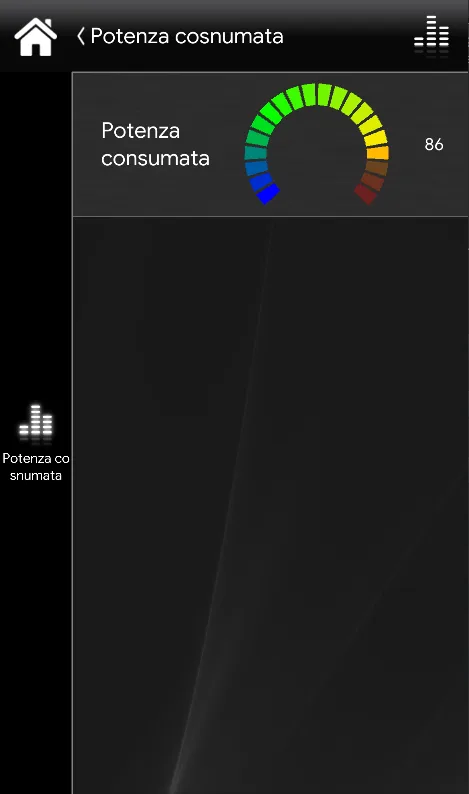
GRAPHIC TEMPLATE: CIRCLE
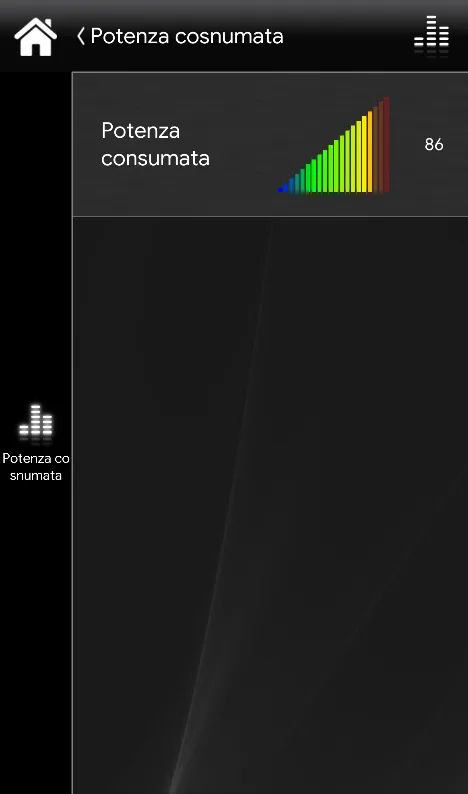
GRAPHIC TEMPLATE: INCREASE
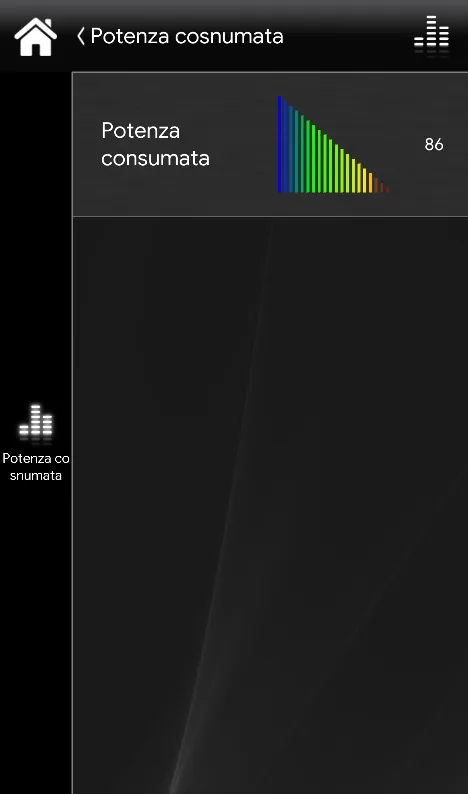
GRAPHIC TEMPLATE: DECREASE
MAP VIEW
Here is the visual result in the Ilevia Control app interface (map style). You can change the size of the bars according to your needs.
You can add as many bars as needed in the same user interface.
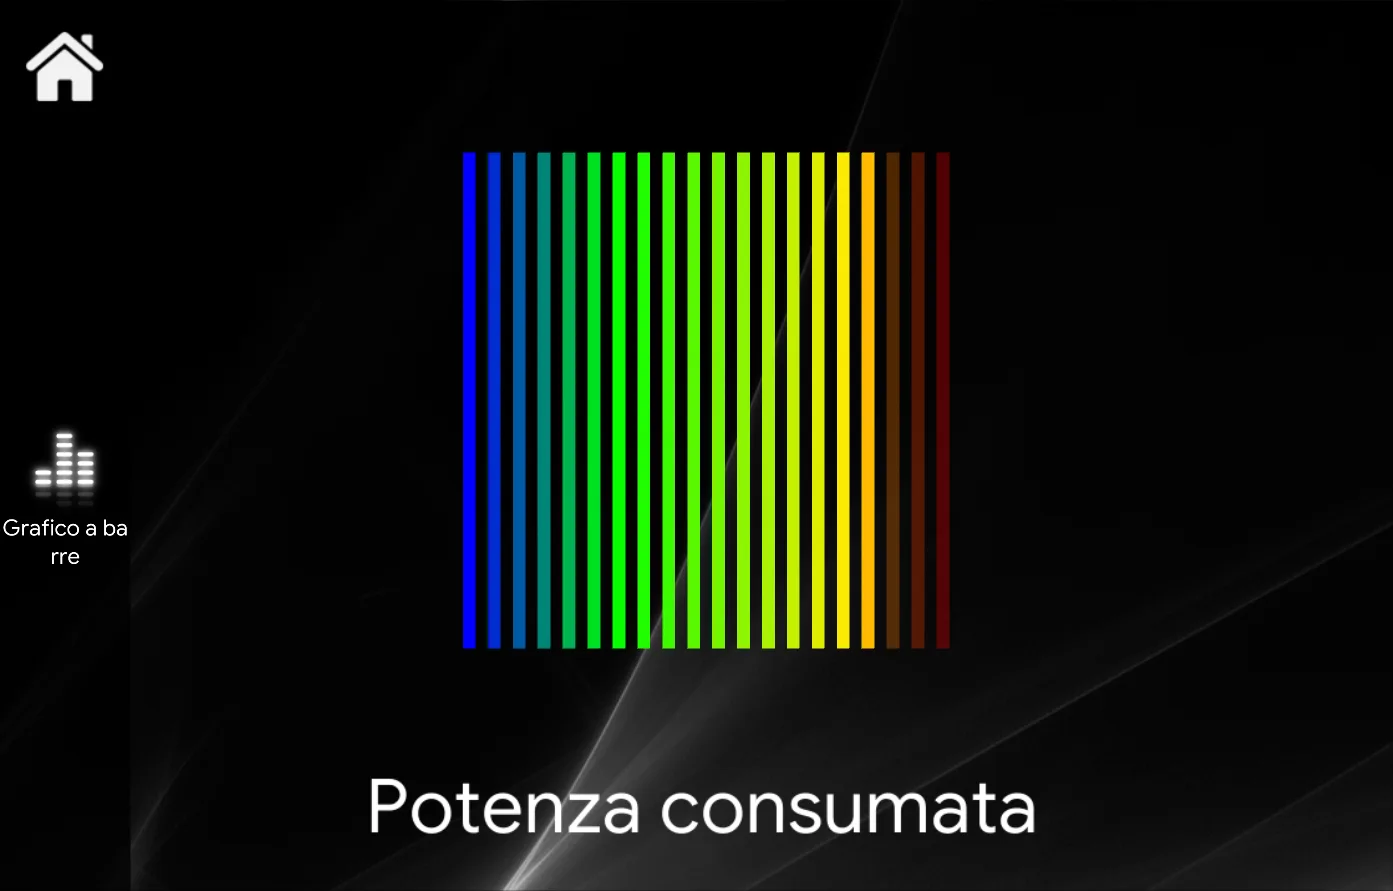
GRAPHIC TEMPLATE: SQUARE
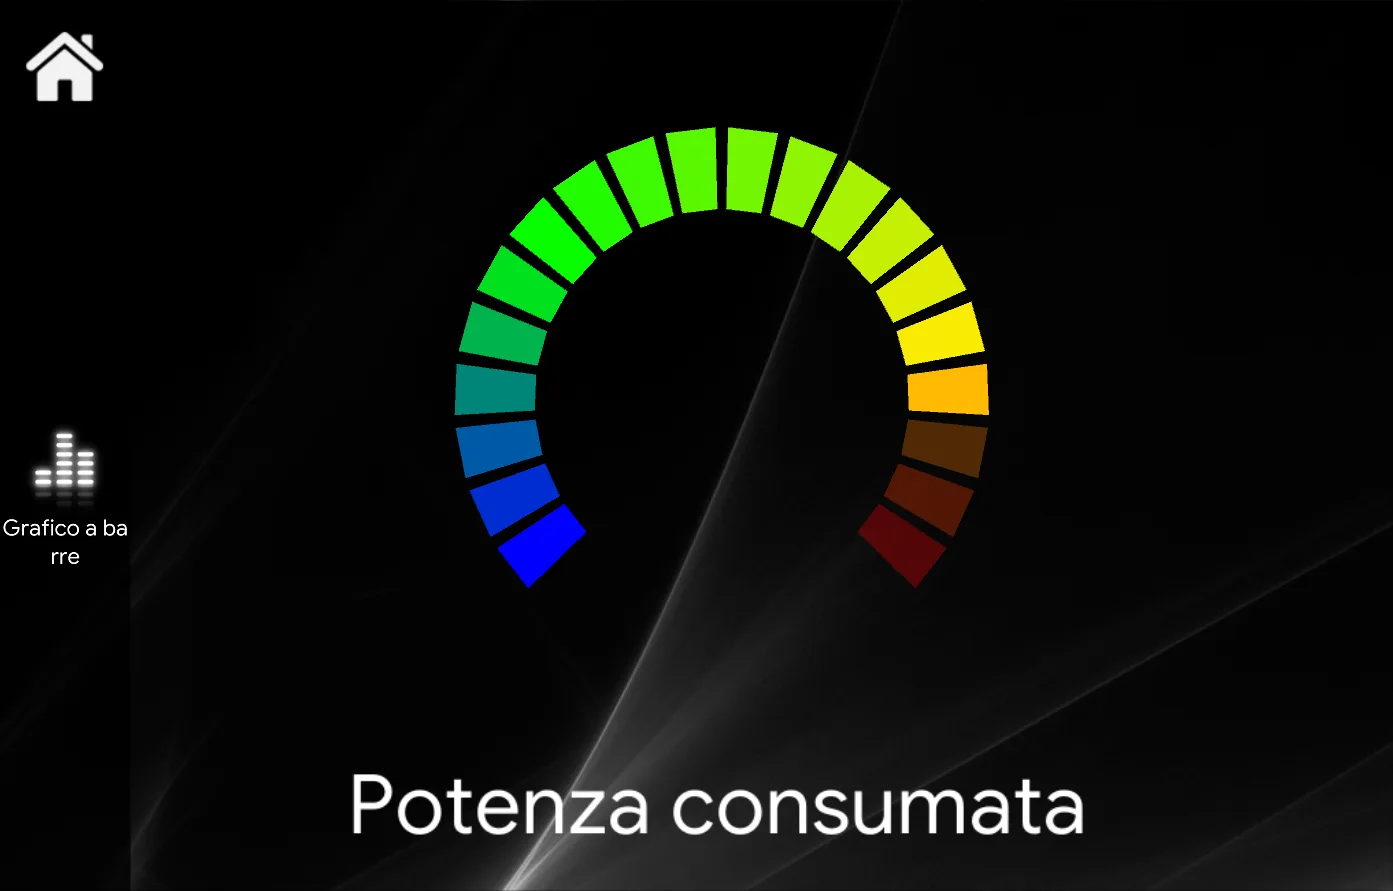
GRAPHIC TEMPLATE: CIRCLE
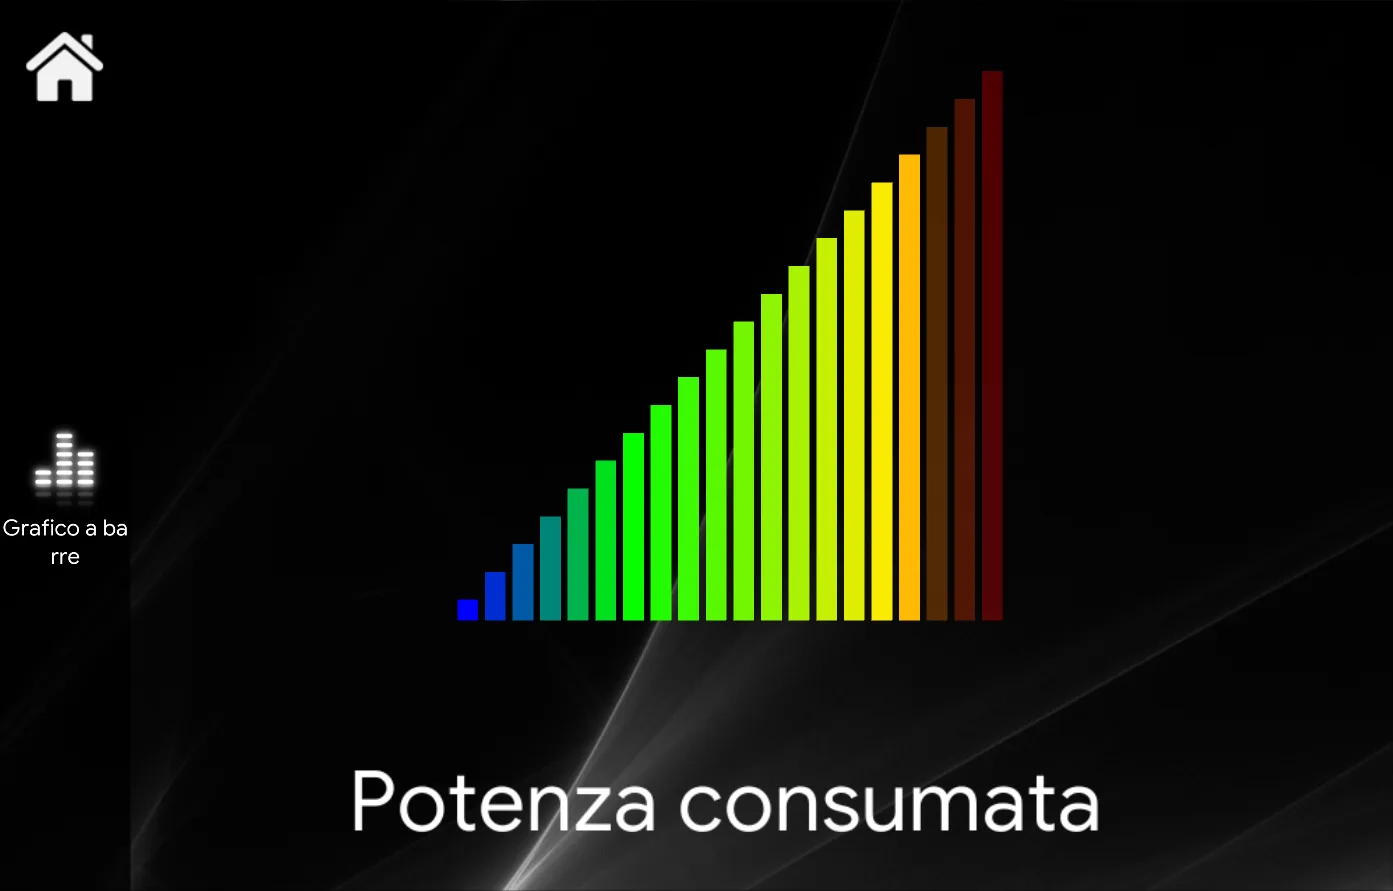
GRAPHIC TEMPLATE: INCREASE
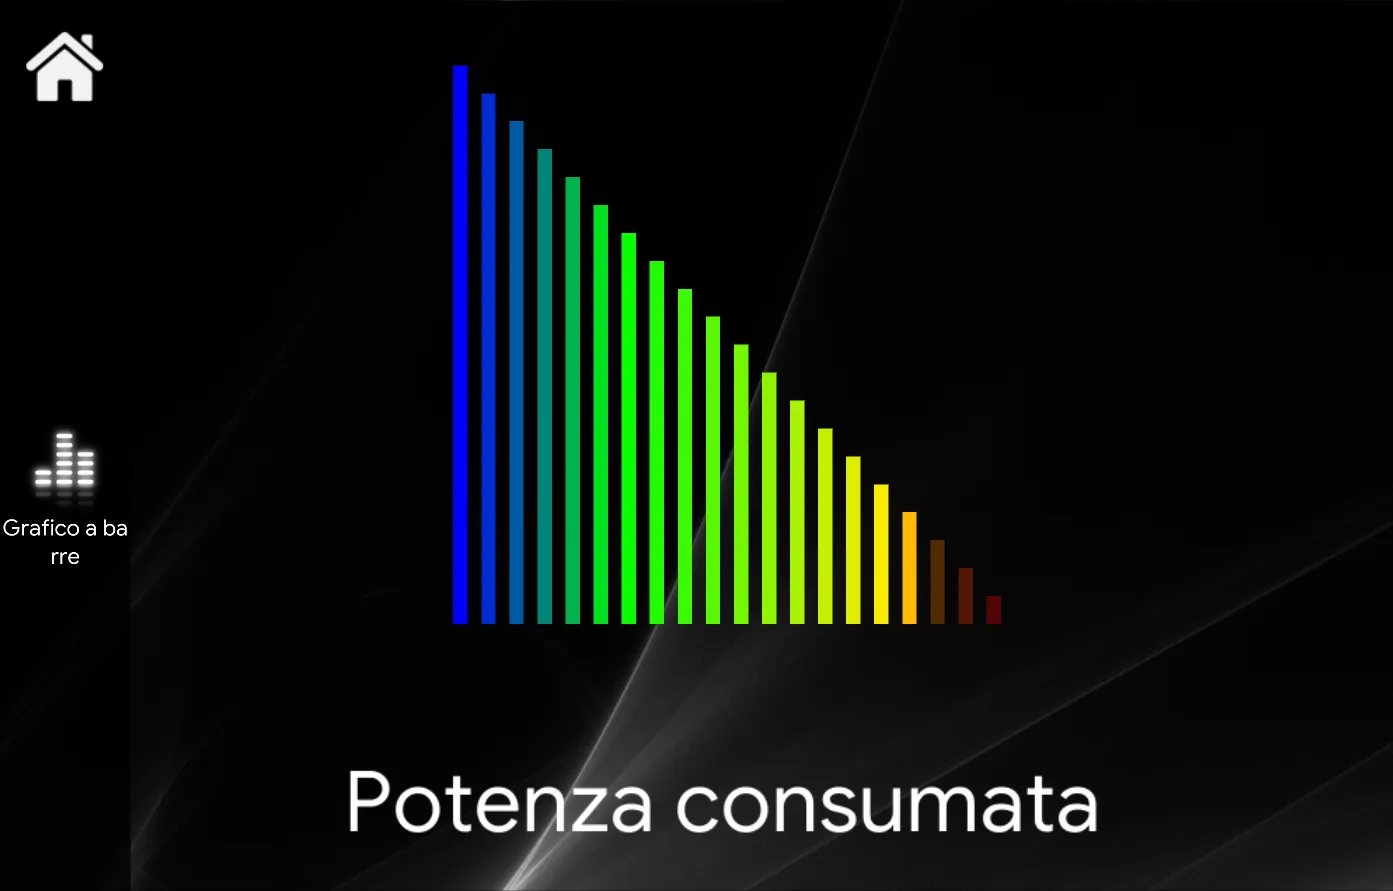
GRAPHIC TEMPLATE: DECREASE